

Weather/climate analyzer and forecaster. Info on global weather models, weather patterns, winter, stratosphere, polar vortex, custom graphics, and more...
Slovenia
Joined July 2010
- Tweets3K
- Following217
- Followers2.6K
- Likes2.9K



Time to answer the question: What can an early-November Polar Vortex collapse (SSW) do to Winter 2026/2027? 🧵👇
These maps are not a forecast or actual temperatures. They show the DIFFERENCE between winters with an early-November collapse and winters without one, in the same El Niño+wQBO setup.
Since there is no real observational data with such an early SSW and nino/QBO combo, I decided to look for data in two independent model sets:
🔹 Climate models (CMIP6, 80 runs): 32 model winters with an early collapse vs. 565 without. All of them with a strong El Niño + westerly QBO, like this year.
🔹 ECMWF SEAS5 seasonal forecast hindcast (1981–2024): 109 forecast members with a collapse vs 444 without. Each is compared only with the other members of the same forecast, so the ocean and El Niño/QBO are identical.
Why 32 vs 565 is ok in the climate models: the big group is the baseline, or the normal El Niño winter without a collapse, as all are the same base state of strong Niño+wQBO, not random winters. It is supposed to look "average", and subtracting it leaves only what the collapse adds. The small group only makes the result noisier, which is why the dots mark where the difference is statistically significant.
December is where both agree:
🇺🇸 Central & Eastern US 1–3 °F colder, while northern Canada around Hudson Bay runs milder
🇪🇺 Scandinavia & NE Europe 1–2 °C colder, with high pressure to the north and lower pressure over the Atlantic
After December, the signal weakens. The climate models fade it out by January. SEAS5 keeps some cold over the central US and over Scandinavia/eastern Europe into January and February.
Bottom line: an early collapse mainly loads the dice for December. It does not lock in a cold winter. But these are just climate simulations, not actual forecasts, as said, only meant to find an underlying signal.
Use these with caution, and do not present them as an actual forecast, as they are not. These show the difference in signal, and if the mean base anomaly is +3, a -1 difference still leaves it at +2, for example.
For phase 2, I am planning to use a larger CMIP6 set, and I am also thinking of making my own custom simulations, as this is a fascinating situation in development.
@judah47 @RyanWeather @webberweather @TWOweather @bam_weather


Want to talk Stratospheric Warming weather impacts? Let's talk! But first of all, *this is NOT a forecast*.
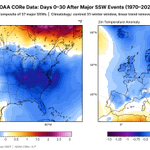
These are typical weather anomalies in the 0-30 days following a Stratospheric Warming event, starting with the wind reversal and the collapse of the #polarvortex.
It also explains why so many people get excited when they hear about something happening in the stratosphere.
What we can see in the temperatures first is a colder trend for the whole eastern half of the United States, and also for the northern and western parts of Europe.
This is an average of 37 different SSW events, so individual impacts can vary from event to event. But the large majority of these events occurred during meteorological #WINTER , and we have no real analogs for an event in early November with a Super El Niño on top.
In terms of snowfall, it follows the cold-spill pattern, with above-normal snowfall in the eastern and northeastern United States, and in a large part of Europe, except in the southeast.
In general, SSW events are sensitive to the existing pattern in the lower levels, and can sometimes fail to couple to the surface. This means that the impacts can be deflected. Some events can also only bring cold and snow to Europe or only to the United States. So this is why there is no "one size fits all" when it comes to stratospheric impacts.
Take care everyone, and thank you all for your interest in the wonders of the stratosphere! 🙏


Let's talk ECM46, the global flagship extended-range model, and the Polar Vortex.
Extended range forecasting is mainly about trends on a bit larger scale and multi-day periods, not actual temperatures 30 days from now at 2:15pm.
But these are often used for stratospheric forecasting too, trying to spot early signs of a Stratospheric Warming event.
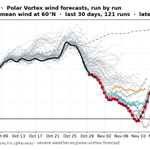
Below is the performance of the ECM46 for the current event, where it was long oblivious to anything happening and only started the downward disruption trend around 10 days ago.
But this is actually normal and can be found in all modern forecasting solutions, especially in the new AI systems. Long-range predictions do operate on a slightly different basis than our usual daily forecasts, so I will take a look at those at some point too.
It also shows how unpredictable the stratosphere really is, both in upward and downward impacts.

Ok, the Stratospheric Warming reversal is pretty much in the bag, or at least landing somewhere around zero. The fact is that the Polar Vortex is getting beaten down in the mid-stratosphere for a little while, much sooner than anyone could imagine.
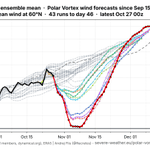
But let's talk about what comes after for the stratosphere. I looked at all three main extended-range ensembles: ECM46, GEFS, and CFSv2. All three have a known bias toward a too-strong Polar Vortex and tend to recover it too fast, so their agreement isn’t fully independent.
Still, they all show a similar recovery pattern. Anything other than at least a partial recovery would be surprising this early in the season. That is due to the deepening polar night, which drives strong radiative cooling that spins the Polar Vortex back up.


After a long battle, the AIFS finally caves in, and the 6z run now also shows a proper Stratospheric Warming event with a wind reversal.
It is also late with the reversal compared to the other two main models, but the question now is whether it will hold this trend or pull back. And we will now see if it will also adjust this timing of the reversal, as it better resolves the first push onto the Polar Vortex


Todays 00z is (by memory) the first run period so far, that all 3 main ensemble systems agree on a #polarvortex wind reversal and an official Stratospheric Warming event. The 2 main single-run models also agree on a reversal, while the AIFS remains the only one yet to show a wind reversal, likely limited by its own design, or time will tell.
While its clear that something is going to happen in the stratosphere, what people want to know is how it will change their daily weather. I think we are still not at a point where we can definitively say "ok THIS is what will change for you".
We all know the usual impacts following an SSW event in mid-winter, and it can greatly increase the chance colder air and snowfall across parts of the United States, Europe, and other mid-latitudes, at least on average.
But we are very early in the season, dealing with the earliest SSW event on record if verified, but we are also dealing with a most easterly based Super El Nino on record. This puts the atmosphere in a very unforgiving setup to find any typical SSW impact right now. Just something to keep in mind as the situation unfolds


I decided to gather some thoughts on the upcoming Polar Vortex disruption and the Stratospheric Warming potential in the blog, going a bit deeper than usually here, also looking at some early weather indications. The article format allows going into more details than in an X post.
severe-weather.eu/global-wea…

As the Polar Vortex disruption is about to start, its time we recap on the forecast accuracy so far. I will do single runs today, and ensembles tomorrow as they update with some delay.
All these products are available in my Polar Vortex hub page, updated twice daily (link at the end 👇)
In the single run category, we have the ECMWF, AIFS, and GFS. Starting with AIFS, this is ECMWF’s machine-learning model. It learned atmospheric behavior from 40+ years of past data instead of computing the physics.
As expected of such model, it has a visible bias towards a too strong Polar Vortex so far. But it is a bit limited to what it learned on past data, and early November Stratospheric Warming is definitely something it has not seen before in learning.
This can limit it in the ability to properly resolve the upcoming disruption. It is slowly catching up, showing a clear weakening trend with each new forecast, but it is still not seeing a wind reversal. Time will tell if this is its own error or an actual very good forecast.
1/n 🧵

Lat from the single-run models is the NCEP GFS. This one also has an obvious strong Polar Vortex bias, as it is consistently showing a too strong vortex. It was also late compared to the IFS to start showing a proper wind reversal in the stratosphere.
But showing a stronger vortex in a disruption event is normal, as the models need some time to get the source of the disruption closer to the analysis time, so its better resolved.

You can monitor this ongoing development yourself in my Polar Vortex hub: severe-weather.eu/polar-vort…

With a lot of talk about the upcoming Polar Vortex disruption and a potentially official SSW (Stratospheric Warming) event, most people cant see what makes this event "unprecedented" as its often called. And for a good reason, as a single map of the #polarvortex can be vague in context. I decided to visualize that context.
The official criteria for an SSW event is the reversal (0 or negative value) of the stratospheric winds at the 10mb level along the 60N polar circle line. We are still on the edge if we will reach a reversal with this event, but there are forecast runs that suggest its likely. Link to those live forecasts is in the comments 👇
Most of the SSW events occur in January and February. I decided to look at every first SSW of each season (some seasons had two) and when it occurred. As you can see, a reversal in the current event would break the record for the earliest SSW on date by at least 3 weeks!
This is really a strong outlier, and having an SSW this early in the season is what makes this event unprecedented in itself, perhaps more so than any temperature or pressure anomaly in the stratosphere.
Its likely not a coincidence we get this with a very strong Super El Niño ongoing in the Pacific. So overall, this is truly a very interesting season for anyone that is into monitoring the weather and seasonal development.

Monitor the Polar Vortex yourself in detail in my live Polar Vortex monitoring hub:
severe-weather.eu/polar-vort…
The roles reverse again, and now ECMWF is back at predicting a Polar Vortex wind reversal and an earliest Stratospheric Warming event on record, while GFS pulls back just above a reversal.
This back-and-forth is likely to go on for a few more runs, since the ensembles are also starting to converge just above the reversal, signaling a very borderline situation.
These live maps are all found in my Polar Vortex hub, link in the comments below. 👇
It is clear that we are going to observe the strongest Polar Vortex disruption in the modern records, and a reversal or not feels more like a technicality at this point. Bottoming out at -1 or 1 is not really a game changer, as its about the event and the drop itself. We can start talking and tracking impacts once the event progress is more or less settled across different models.


