






Geospatial Agentic Services (GAS) Toward Interoperable and Scalable Autonomous GIS by Zhenlong Li, PhD
bpb-us-e1.wpmucdn.com/sites.… Federal GeoAI Community of Practice, a federal-facing coordination and knowledge-sharing forum for applied #geoai #ai #gis @Esri

33
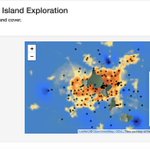
Heat and humidity: online platform in R Shiny by Chris Kucharik - original funding from the @NSF original funding from the National Science Foundation (NSF) Observe temperature patterns by site or land cover. connect.doit.wisc.edu/urbanH… #urbanheat #gis #map #data

106
🏥Measuring Spatial Accessibility to Healthcare: From GIS Modeling to Health Outcomes @ipums -- Grace Cooper & Devon Kristiansen Supported by USGS Grant #GIS #SpatialAnalysis #HealthcareAccessibility #HealthGeography #RStats @ipums @Roddar_LLC #DataScience #PublicHealth


23
🏥Measuring Spatial Accessibility to Healthcare: From GIS Modeling to Health Outcomes @ipums -- Grace Cooper & Devon Kristiansen
Supported by USGS Grant #GIS #SpatialAnalysis #HealthcareAccessibility #HealthGeography #RStats @ipums @Roddar_LLC #DataScience #PublicHealth


20
Rod Sardari retweeted

Researchers at Cornell have created an interactive map identifying 1.8 million individual trees in New York City, with a new approach that could optimize the placement of trees for cooling in cities around the world.
In the study, researchers identify the types of trees using satellite imagery as well as on-the-ground datasets and 3D data collected with lidar, short for light detection and ranging. The approach was 82% accurate overall and higher for common types of New York City trees.
It’s the first “wall-to-wall,” citywide map identifying trees in natural areas and other unsurveyed areas, which together constitute an estimated 65% of the city’s canopy and have not been accounted for on previous maps.
The research team will use the map to determine which trees are best for cooling, and the data could inform a host of other planting decisions where the type of tree makes a difference, from reducing allergens to managing invasive pests.
Read more: news.cornell.edu/stories/202…

ALT In a new interactive map of New York City, researchers were able to identify 1.8 million trees, 1.4 million of which had never been surveyed.
#makeoverMonday's Data Visualization: 📈
Squirrel Census dataset: shorturl.at/7XzRx
#EverythingIsData #DataVisualization @tableaupublic @tableau

22
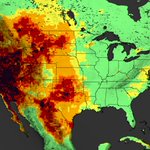
🔥 Wildfire Smoke Across the Pacific Northwest 📷 Data + Remote Sensing + Visualization
@NASAScience_ @NASAEarth @NASAEarthData
@Esri #wildfire @Roddar_LLC #RemoteSensing #GIS #Geospatial

36
🔥 Wildfire Smoke Across the Pacific Northwest 🌎 Data + Remote Sensing + Visualization @NASAScience_ @NASAEarth @NASAEarthData @Esri #wildfire
34
📢 PhD Openings at the DRIS Lab, Boise State University. Email your CV to [email protected] subject line "MS/PhD Application_[Your Name]". #PhDPosition #CivilEngineering #DisasterResilience #InfrastructureResilience #StructuralEngineering #BoiseStateUniversity

1
37
Introduction to subagents by @AnthropicAI : Learn how to use and create sub-agents in @claudeai Code to manage context, delegate tasks, build specialized workflows. #Agent #AI #SubAgent #AITraining #LLM #ClaudeCode #Training @Roddar_LLC #Workshop #DataFam
29
🌑 Data visualization meets cosmos: Alexandre Bogachev has created an impressive interactive atlas featuring 11,898 solar eclipses spanning 5,000 years #DataVisualization #GIS #Geospatial #DataFam @Roddar_LLC #CreativeCoding #DataStorytelling #Astronomy #InteractiveData #NASA
19
🌑 Data visualization meets cosmos: Alexandre Bogachev has created an impressive interactive atlas featuring 11,898 solar eclipses spanning 5,000 years #DataVisualization #GIS #Geospatial #DataFam @Roddar_LLC #CreativeCoding #DataStorytelling #Astronomy #InteractiveData #NASA
18
Walking With Ghosts
Authored By Deanne Watts
Organization @womeningis
Awards Finalist | Artistic
#esri #gis #uc26
mapgallery.esri.com/submissi…

14
From Sand to Scoop: Mapping the Sweetest Path from the Shoreline to Nearby Ice Cream Shops
esri.com/en-us/about/events/…
Authored by Stephanie Pelletier from VHB

17
How to raise kids who question AI (Randi Williams | Play@TED) ted.com/talks/randi_williams… via @TEDTalks

14
Why AI will never replace a great teacher (Matt Wu | TED2026) ted.com/talks/matt_wu_why_ai… via @TEDTalks

21
Is AI turning us all into the same person? (Sandra Matz | TEDxNewEngland) ted.com/talks/sandra_matz_is… via @TEDTalks

19

Rod Sardari retweeted

It's thanks to Simon that I'm able to go all-out, be the most creative, fun, weird, whimsical and vibrantly colored that I can be in my creation of elaborate data visualization stories. Thank you so so much! ❤️
(Another one from a few years back 😉 WhyDoCatsAndDogs.visualcinna… 🐈🐕)


What happens when you add data and birds into the equation? The latest visual by @NadiehBremer is perhaps her most ambitious yet, an incredible exploration of Google Trends data and birding across America.
simonrogers.net/2026/02/12/d…

Rod Sardari retweeted
📈 Data Visualization
🎨 Data Art
💻 Generative Art
I ❤️ creating it all!
Here's some of my favorite (client & personal) projects over the past years, incl Scientific American, Google, Sony Music, The New York Times, UNESCO & more
All my work & art 👇
VisualCinnamon.com
