

I price where options are rich, cheap, and lying. VRP · Skew · Earnings implied vs realized · Risk · and way too many questions for @grok Premium seller. NFA
- Tweets9.5K
- Following646
- Followers8K
- Likes8.8K
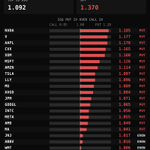
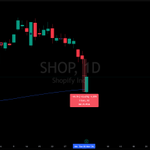




ALT Table called Earnings Week Nov 2 to 6, nine companies in report order. For each: Oct 30 close, the straddle's priced move for the coming report, mean implied move across its 8 prior prints, a count of how those 8 first opens fell (under, within or over each straddle's range), and its mean absolute close move on those prints. AAPL Mon after close 344.63, 4.3%, 4.0%, 1 7 0, 2.5%. PLTR Mon after close 184.11, 13.3%, 12.1%, 0 4 4, 14.8%. SHOP Tue pre open 157.49, 13.8%, 12.4%, 0 5 3, 11.6%. AMD Tue after close 504.80, 8.9%, 8.2%, 2 5 1, 8.8%. SMCI Tue after close 32.95, 14.2%, 15.4%, 2 6 0, 13.6%. UBER Wed pre open 65.25, 8.1%, 7.3%, 1 7 0, 5.5%. DDOG Wed pre open 235.27, 15.1%, 11.3%, 1 5 2, 12.2%. QCOM Wed after close 164.79, 10.0%, 6.9%, 1 6 1, 6.3%. NET Thu after close 280.70, 15.2%, 11.7%, 1 7 0, 10.1%. Footer @SPXVIX.


ALT Table called Earnings Week Nov 2 to 6, nine companies in report order. For each: Oct 30 close, the straddle's priced move for the coming report, mean implied move across its 8 prior prints, a count of how those 8 first opens fell (under, within or over each straddle's range), and its mean absolute close move on those prints. AAPL Mon after close 344.63, 4.3%, 4.0%, 1 7 0, 2.5%. PLTR Mon after close 184.11, 13.3%, 12.1%, 0 4 4, 14.8%. SHOP Tue pre open 157.49, 13.8%, 12.4%, 0 5 3, 11.6%. AMD Tue after close 504.80, 8.9%, 8.2%, 2 5 1, 8.8%. SMCI Tue after close 32.95, 14.2%, 15.4%, 2 6 0, 13.6%. UBER Wed pre open 65.25, 8.1%, 7.3%, 1 7 0, 5.5%. DDOG Wed pre open 235.27, 15.1%, 11.3%, 1 5 2, 12.2%. QCOM Wed after close 164.79, 10.0%, 6.9%, 1 6 1, 6.3%. NET Thu after close 280.70, 15.2%, 11.7%, 1 7 0, 10.1%. Footer @SPXVIX.


ALT Card: a call and a put at the same strike. Big number: 16, the strikes whose implied index level landed inside the range $SPX traded in the last minute of Monday. Dot chart of each strike's implied index level against a shaded band for that $SPX range, green dots inside and orange dots outside. Bottom tile: 18 strikes with both a call and a put trade.

ALT Card: long $VIX funds. Big number: 6.4%, the average daily gain in $VIXY on the days $VIX rose more than 10% over the past year. Bar chart of each of those days in order, an orange $VIXY bar next to a shorter green $VIXM bar every time. Bottom tile: 1.6%, the average $VIXM gain on the same days.


