

#ASX charts & TA comments without nonsense. Get in at or near a base tight stops never chase. My chart read is opinion only so please do your own research
NSW North Coast Australia
Joined August 2011
- Tweets27.5K
- Following937
- Followers17.5K
- Likes18K

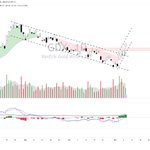


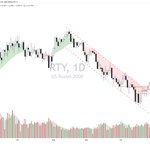

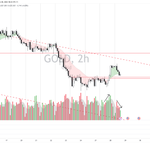


After Tuesday close #asx scan for trending stocks and sectors. Strongest near the top - weaker or emerging down below. Stocks are divided into trend ordered volatility sub groups where A Stocks = Very High Volatility B Stocks = High C Stocks = Above Average D Stocks = Below average E Stocks = Low F Stocks = Very Low Volatility. The groups at the end of the list are showing current trending sectors (weekly or daily chart)
tradingview.com/watchlists/3…

1
14
978
Deeper scan of the Tuesday #asx Trending Stocks list looking for recent strength, little dips, or pullbacks
tradingview.com/watchlists/3…
3
357
After Monday close #asx scan for trending stocks and sectors. Strongest near the top - weaker or emerging down below. Stocks are divided into trend ordered volatility sub groups where A Stocks = Very High Volatility B Stocks = High C Stocks = Above Average D Stocks = Below average E Stocks = Low F Stocks = Very Low Volatility. The ticker groups at the end of the list are showing current trending sectors (weekly or daily chart)
tradingview.com/watchlists/3…
1
8
974
Deeper scan of the Monday #asx Trending Stocks list looking for recent strength little dips and pullbacks
tradingview.com/watchlists/3…
2
391
After Friday close #asx scan for trending stocks and sectors. Strongest near the top - weaker or emerging down below. Stocks are divided into trend ordered volatility sub groups where A Stocks = Very High Volatility B Stocks = High C Stocks = Above Average D Stocks = Below average E Stocks = Low F Stocks = Very Low Volatility. The ticker groups at the end of the list are showing current trending sectors (weekly or daily chart)
tradingview.com/watchlists/3…
Deeper scan of the Friday #asx Trending Stocks list looking for recent strength little dips and pullbacks
tradingview.com/watchlists/3…
3
404
After Thursday close #asx scan for trending stocks and sectors. Strongest near the top - weaker or emerging down below. Stocks are divided into trend ordered volatility sub groups where A Stocks = Very High Volatility B Stocks = High C Stocks = Above Average D Stocks = Below average E Stocks = Low F Stocks = Very Low Volatility. The ticker groups at the end of the list are showing current trending sectors (weekly or daily chart)
tradingview.com/watchlists/3…
1
9
1,037
Deeper scan of the #asx Thursday trending stocks list looking for recent strength little dips and pullbacks
tradingview.com/watchlists/3…
2
448
After Wednesday close #asx scan for trending stocks and sectors. Strongest near the top - weaker or emerging down below. Stocks are divided into trend ordered volatility sub groups where A Stocks = Very High Volatility B Stocks = High C Stocks = Above Average D Stocks = Below average E Stocks = Low F Stocks = Very Low Volatility. The ticker groups at the end of the list are showing current trending sectors (weekly or daily chart)
tradingview.com/watchlists/3…

1
14
1,260
Deeper scan of the #asx Trending Stocks list looking for recent strength little dips and pullbacks
tradingview.com/watchlists/3…
1
478


After Tuesday close #asx scan for trending stocks and sectors. Strongest near the top - weaker or emerging down below. List of stocks is divided into trend ordered volatility sub groups where A Stocks = Very High Volatility B Stocks = High C Stocks = Above Average D Stocks = Below average E Stocks = Low F Stocks = Very Low Volatility. The ticker groups at the end of the list are showing current trending sectors (weekly or daily chart)
tradingview.com/watchlists/3…

16
1,282
After Monday close #asx scan for trending stocks. Strongest near the top - weaker or emerging down below. List is divided into trend order volatility sub groups where A Stocks = Very High Volatility B Stocks = High C Stocks = Above Average D Stocks = Below average E Stocks = Low F Stocks = Very Low Volatility. The ticker groups at the end of the list are showing current trending sectors
tradingview.com/watchlists/3…
1
10
1,295
Deeper scan of the Monday #asx trending stocks list looking for recent strength, little dips, & pull backs
tradingview.com/watchlists/3…

3
487
After Friday close #asx scan for trending stocks. Strongest near the top - weaker or emerging down below. List is divided into trend order volatility sub groups where A Stocks = Very High Volatility B Stocks = High C Stocks = Above Average D Stocks = Below average E Stocks = Low F Stocks = Very Low Volatility. The ticker groups at the end of the list are showing current trending sectors
tradingview.com/watchlists/3…
2
15
1,089
Deeper scan of the Friday #asx trending stocks list looking for recent strength, little dips, & pull backs
tradingview.com/watchlists/3…
3
392

After Thursday close #asx scan for trending stocks. Strongest near the top - weaker or emerging down below. List is divided into trend order volatility sub groups where A Stocks = Very High Volatility B Stocks = High C Stocks = Above Average D Stocks = Below average E Stocks = Low F Stocks = Very Low Volatility. The ticker groups at the end of the list are showing current trending sectors
tradingview.com/watchlists/3…
1
15
1,471
Deeper scan of the Thursday #asx trending stocks list looking for recent strength, little dips, & pull backs
tradingview.com/watchlists/3…
1
438