

MD Forestry & Environmental Sciences | PhD in Earth Observation from space Remote Sensing & GIS | INVA spa | Post-doc @unito 🌍🛰🌲🌱🦊 @ait_italiana
Vallée d'Aoste, Piemonte (IT)
Joined December 2011
- Tweets7.7K
- Following4.7K
- Followers1.2K
- Likes6K


Pinned Tweet
- GIS & Remote Sensing Specialist R&D at INVA spa (Italy) 🛰🌍 invallee.it/home
- Post-Doc Research collaborator at @DISAFA_INT @unito
disafa.unito.it/do/docenti.p…
share.google/1nC5ol7AdeaFmJ9…
Orcid:
orcid.org/0000-0001-6750-043…
Google Scholar: share.google/GBZk2JIuSFGiDfz…
Tommaso Orusa retweeted

A popular piece for everyone using QGIS and remote sensing data - 𝐂𝐨𝐩𝐞𝐫𝐧𝐢𝐜𝐮𝐬 𝐂𝐨𝐧𝐧𝐞𝐜𝐭 by @Copernicus EEA , a smart QGIS plugin allowing you easily to download, visualize, and explore Copernicus layers:
More: land.copernicus.eu/en/news/c…
𝐓𝐡𝐞 𝐍𝐞𝐰 𝐒𝐜𝐢𝐞𝐧𝐜𝐞 𝐨𝐟 𝐌𝐚𝐩𝐬 - thenewscienceofmaps.com/

Tommaso Orusa retweeted

We are delighted to see 4 GEO Work Programme activities showcased in the 2026 @CEOSdotORG Earth Observation Handbook on Adaptation and Resilience, alongside 8 from the wider GEO community.
The Handbook will be featured today at #COP31.
Find our more ⤵️
earthobservations.org/about-…


Tommaso Orusa retweeted

Struggling with messy legends in your plots? The legendry package for ggplot2 helps you create cleaner and more effective visualizations in R. With better control over legends, it makes your plots easier to understand.
Here’s why legendry is a game-changer:
✔️ Customizable Legends: Fine-tune legend positions, titles, and layouts effortlessly.
✔️ Enhanced Readability: Improve plot clarity by adjusting legend elements to fit your audience’s needs.
✔️ Consistency Across Plots: Maintain uniform legend styles when working with multiple data sets.
✔️ Simplify Complex Visualizations: Organize information better by segmenting legends.
✔️ Seamless Integration: Works smoothly with ggplot2 and the tidyverse for an efficient workflow.
The visualization shown below is taken from the package website: teunbrand.github.io/legendry…
If you want to learn more about data visualization in R using ggplot2 and its extensions, you might check out my online course on "Data Visualization in R Using ggplot2 & Friends"! More info: statisticsglobe.com/online-c…
The next cohort begins on November 9, 2026. Anyone can register for the course, but Statistics Globe Hub members benefit from a special 50% discount until the start date.
#datascienceeducation #datastructure #R #Python #RStats

Tommaso Orusa retweeted
Want to explore your data in Python with minimal code?
Try PyGWalker!
With just a few lines of code, PyGWalker transforms your dataset into an interactive drag-and-drop workspace for data exploration. Create visualizations, filter and group data, and uncover insights without spending hours writing plotting code.
It's a fast and intuitive way to perform exploratory data analysis and better understand your data.
Subscribe to my newsletter for more content on statistics, data science, AI, and programming with R and Python. More information: statisticsglobe.com/newslett…
#datastructure #statisticsclass #pythonprogramming #Python #DataScientist
Tommaso Orusa retweeted

Version 2.0 of R Observatory is now out!
It puts everything about an R package from CRAN or Bioconductor on one page.
V2 contains over twenty-three new features since July and an improved mobile browsing experience!
observe.rstats.dev
#rstats

ALT Social card for R Observatory, with its logo and the address observe.rstats.dev. Large text reads "Look up any R package or dataset". The card shows a sky of small blue lights, each an R package, with one star ringed in orange. It also shows ggplot2's page on the site: CRAN checks OK, notes on 5 of 13, 2.0M CRAN 30-day downloads, 5,023 dependent packages, 81% test coverage and advisories None known.
GitHub - Oldcircle/geo-sleuth: An agent skill that finds where a photo was taken. OpenStreetMap geometry, elevation skylines, satellite imagery and street view and shows its work. Works with Claude Code, Codex, Cursor, Gemini CLI, OpenCode and much more... share.google/uzOwlLu5WULAqrv…

1
67
Tommaso Orusa retweeted
For those of you working in R, an exciting package on urban morphology just landed on CRAN - geomorphR by @Jonathan Cohen! Hope to see this in Python soon!
It extracts geometric descriptors from building footprints stored as sf objects, so all you need is a bunch of polygons to describe urban form at any scale or feed it into ML models.
𝐂𝐑𝐀𝐍: cran.r-project.org/web/packa…
𝐓𝐡𝐞 𝐍𝐞𝐰 𝐒𝐜𝐢𝐞𝐧𝐜𝐞 𝐨𝐟 𝐌𝐚𝐩𝐬 - thenewscienceofmaps.com/

Tommaso Orusa retweeted
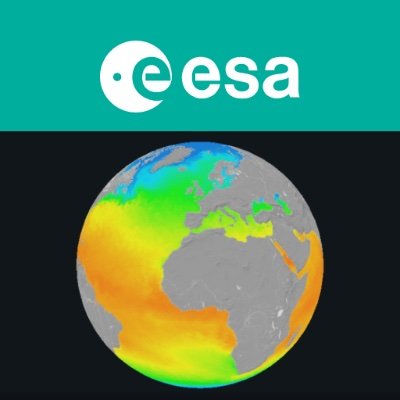
🗺️ Bring R and Python together for climate data analysis!
Our new R-Demonstrator shows how ESA's Climate Change Initiative (CCI) Toolbox can be used within R-Scripts:
🔗 Work across R and Python in one environment
📊 Visualise climate data
⚡ Carry out statistical analyses and apply spatio-temporal operations
A practical route for researchers who use R and want flexible access to climate-data tools. Start exploring the R-Demonstrator now: github.com/esa-cci/ect-demon…

ALT Using R to plot atmospheric carbon dioxide from the Greenhouse Gas ECV, derived with the EMMA algorithm from GOSAT measurements
Tommaso Orusa retweeted

¿Quieres aprender a automatizar tareas en QGIS utilizando Python?
Pues este curso te interesa:
youtube.com/watch?v=qgwlPs9n…


Tommaso Orusa retweeted

RustGIS has reached 2,000 GitHub stars and welcomed more than 40 contributors in just two weeks! 🎉
Thank you to everyone who has starred the project, tested the app, reported bugs, suggested features, improved the documentation, or contributed code. Your contributions are helping turn RustGIS into a better tool for the geospatial community.
RustGIS is a fast, free and open-source GIS written in pure Rust. It runs on Windows, macOS, Linux and in your browser, with tools for mapping, editing, analysis, 3D terrain, planetary mapping and publication layouts.
RustGIS provides a familiar Ribbon-style user interface, a native desktop experience, and an agent-centric architecture. One of its key design principles is that almost everything can be accomplished through commands, making it easier to automate workflows, write scripts, and allow AI agents to interact directly with the application. RustGIS is still in its early stages and is undergoing rapid development. Expect frequent updates, new capabilities, and potentially significant changes as the architecture and ecosystem evolve.
We’re just getting started, and new contributors are very welcome!
There are many ways to get involved: test RustGIS with your own datasets, report an issue, improve a tutorial, translate the interface, or help build the next feature. GIS users, developers, researchers, students and first-time open-source contributors all have something valuable to bring.
Have an idea or a workflow you’d like RustGIS to support? Open an issue and join the conversation. Let’s build it together.
Try it out
- Launch the web app: web.rustgis.app
- Download: downloads.rustgis.app
- Documentation: rustgis.app
- GitHub: github.com/opengeos/RustGIS
#RustGIS #GIS #OpenSource #Geospatial #Rust #OpenScience
Tommaso Orusa retweeted
Geospatial find of the day - recent preprint titled 𝐌𝐚𝐩𝐩𝐢𝐧𝐠 𝐚𝐧𝐝 𝐂𝐥𝐚𝐬𝐬𝐢𝐟𝐢𝐜𝐚𝐭𝐢𝐨𝐧 𝐨𝐟 𝐓𝐫𝐞𝐞𝐬 𝐎𝐮𝐭𝐬𝐢𝐝𝐞 𝐅𝐨𝐫𝐞𝐬𝐭𝐬 𝐮𝐬𝐢𝐧𝐠 𝐃𝐞𝐞𝐩 𝐋𝐞𝐚𝐫𝐧𝐢𝐧𝐠 by @Moritz Lucas et al.
The study tells apart hedgerows, individual trees, groves and forest in farmland, using high-resolution aerial imagery from four agricultural landscapes in Germany. Highlights:
- Vision Transformers performed best among the deep learning architectures tested.
- They understand spatial context better than CNNs, which matters a lot when structure is what separates these classes.
- The dataset and code are open source.
𝐏𝐚𝐩𝐞𝐫: sciencedirect.com/science/ar…
𝐂𝐨𝐝𝐞: github.com/Moerizzy/TOFMappe…
𝐓𝐡𝐞 𝐍𝐞𝐰 𝐒𝐜𝐢𝐞𝐧𝐜𝐞 𝐨𝐟 𝐌𝐚𝐩𝐬 - thenewscienceofmaps.com/


Tommaso Orusa retweeted

Meet EDMT: Environmental Data Management Toolbox.
An open-source Python library for turning Earth observation data into environmental insights.
🛰️ Satellite data
📈 Time-series analysis
🗺️ Environmental monitoring
🐍 Reproducible workflows
Explore: envdmt.github.io/EDMT/ #GIS
🤖 Made with AI

Tommaso Orusa retweeted

Remote Sensing Data Processing Workflow: A Step-by-Step Guide
geowgs84.com/post/remote-sen…

Tommaso Orusa retweeted

The team at Ai2 also created an interactive site explaining the Earth embeddings they released, I really encourage you to take a look at it: narrative.allen.ai/olmoearth…
When I say I want to make data more accessible, this is exactly the kind of stuff I also want to make! (does anyone know who made this in the team? I want to nerd out with them!)


Tommaso Orusa retweeted

As Arctic tundra thaws, minerals long trapped in frozen soil are leaching into rivers, turning them orange and acidic.
A study from northern Alaska found “rusting” waters to be more metallic and acidic than drainage from metal mines.
e360.yale.edu/digest/alaska-…
