

Passcodes: Consistency & Methodology. 2 account blow-ups did not put me back. On my way to float free. Tweets for own records
Canada
Joined October 2017
- Tweets2.8K
- Following20
- Followers245
- Likes1.7K





A S M retweeted

When do markets bottom?
Markets bottom not when things look bleak. They do when there is absolute pandemonium.
What indicators are there that can reliably predict a short term bottom?
Here's a few:
$VIX over 30 (at 28 now)
$BPSPX below 40 (at 43 now)
$NYLOWS over 500 (at 400 now)
But the king of them all is the ratio of $NYLOWS to $NYHIGHS.
This measures panic to hope ratio. That is the ultimate indicator. It tells you when there is insane panic and no hope left.
Here's the chart post tariffs low panic. We are there. The reading is at 50 today. RARE.
The bottom is very close. This chart is proof.
If you want to play safe, wait for this spike to disappear. Once the ratio drops below 5, it's safe again.
And if you are like me, this is the time to reshuffle and get on to your fastest horses. Cheers!

A S M retweeted

$Nasdaq $QQQ printed a smaller range INSIDE DAY candle today. The MACD/RSI divergences are still intact, thus Keeping the reversal scenario valid. V-shaped reversals are great when they happen but most Reversals aren't V-shaped. Often times a market reversal makes multiple attempts to get the ball rolling! You'll see a few attempts to break support without much progress before a full blown reversal gets going. My 2 cents!


From the 'Things I Learned After 15 Years of Trading' post!
artoftrading.net/post/things…
#7
Sentiment is always most negative on bottom retests than in the 1st low; Watch out above if the retest is successful
#8
Most double bottoms come with strong MACD/RSI divergences; a powerful event if you see this
$NASDAQ doing just that right now as we speak!


1. The recent stock correction is lead by: liquidation to create new position on IPOs (anthropic as example) + generating cash to correct the negative cash flow hit most Ai whales. The growth is massive and this is a clear sign it is a short term move to address technical issues
1
29
2. Also its widely seen to me as a re-alignment of investment preparing to sign a deal with Iran, where investments are reshaped into the infrastructure of the deal
1
25
A S M retweeted

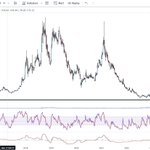
12/x And here's the thing about the 200-week SMA.
Every single time Bitcoin has dipped below it, it was the buy of a lifetime:
🔸 2015 → pico bottom
🔸 2020 COVID → below $6K
🔸 2022 → below $20K
If you bought below the 200-week SMA and held, you never lost money.


A S M retweeted

The Fed is behind the curve + multiple-rate cuts are likely coming soon...
As the unemployment rate rises and growth becomes scarce, growth stocks should benefit from easing.
We've invested in disruptive businesses and publish research on our holdings alphatarget.com


