

Systematic, data-driven algo trader compounding at a 54% CAGR. Focused on Bitcoin, Technology & Gold.
CTM →
Joined November 2017
- Tweets28.1K
- Following579
- Followers80K
- Likes32.8K




Pinned Tweet
Knowing when to be in the market, when OUT and on which side is #priceless
CTM is roaring in the bliss.
Learn how a mechanical systematic edge is developed and why it offers you a strong edge in the markets, youtu.be/eiSuOfkywfM


Have you ever seen bitcoin outperform gold during a bear market?
Maybe this time is different or more likely not.
Bitcoin bull.

In bear markets new legs often begin with spike to entice buyers.
In bull markets new legs often begin with a flush.
Which market are we in?

Chinese open-source AI models continue to improve, yet Chinese AI and technology stocks are crashing.
China’s STAR50 has lost roughly 40% in less than four months.
This is something investors should be paying very close attention to.
AI can be revolutionary without every company participating in that revolution being a profitable investment.
Technological breakthroughs and shareholder returns are two very different things.
The real question is no longer just who builds the best AI. It is who ultimately captures the economic value.

$AMZN CEO Andy Jassy says “a good chunk of 2028 is sold out,” while AWS is already having to allocate scarce memory between AI accelerators and its core cloud business.
This reinforces what SpaceX and Nebius have been signaling. $SPCX is struggling to secure available compute, while Nebius believes it could sell out its 2027 capacity at current prices.
Think about that for a moment. We are talking about the world’s largest cloud provider facing supply constraints extending into 2028, with demand continuing to compete for already limited resources.
The AI bears have been warning about a massive compute glut by 2028. I’m not dismissing that possibility, but the evidence continues to point in the opposite direction.
The question is becoming less about whether AI demand is real and more about whether the infrastructure can be built fast enough to satisfy it.
There's enormous short positioning in Treasury futures, and if the 10-year continues moving lower, we could see a significant unwind that pushes yields down even further.
My hesitation - if it's primarily short covering and improving demand for Treasuries, that could set up a substantial rally in equities. However, if money is rotating into Treasuries because of deteriorating growth expectations and concerns surrounding AI, that's a different story.
We've been looking for a squeeze in bonds followed by another move higher in yields. So far, this could fit that scenario. I just wouldn't assume the 10-year has topped permanently.
The key for me is whether credit spreads stabilize as yields decline. If they do, we could absolutely see some serious squeezing in equities.

The Bond Market Is Setting Up a Trap.
We've been anticipating a sharp rally in Treasuries, and the setup is getting closer.
A reversal in the 10-year yield could trigger systematic CTA short covering, forcing bond futures higher and accelerating the move.
The result? A powerful bond rally that convinces many investors the top in yields is finally in.
We believe they'll be wrong.
Our thesis is that this rally will ultimately be faded, with yields resuming their march higher.
Timing is everything: first the short squeeze, then the reversal.
We've been patiently waiting for this setup, and our entry may be arriving right on schedule.
The first move isn't always the real move.

Bloom Energy (BE) is approaching a critical technical inflection point, and the timing is especially interesting.
Three developments concern me:
(1) Lower highs: The recovery toward $290 failed to challenge the previous peak near $350.
(2) Selling pressure: Today's nearly 8% decline is occurring directly into major support.
(3) Potential trend reversal: A decisive break could change the structure from a correction within an uptrend to a more substantial decline.
Earnings today after the bell.
The fundamentals are strong, but expectations are enormous.

Could this become the pretext for locking down the internet, ultimately requiring biometric identification for access even after the threat has passed?
And could it also provide the justification to fire up the money printer BRRRRRRRRRR to contain the economic fallout and widespread financial casualties that follow?
How else is Elon hitting $500-$1T 2027 target?
Yes, timing + managing your risk = everything in this business.

The Bond Market Is Setting Up a Trap.
We've been anticipating a sharp rally in Treasuries, and the setup is getting closer.
A reversal in the 10-year yield could trigger systematic CTA short covering, forcing bond futures higher and accelerating the move.
The result? A powerful bond rally that convinces many investors the top in yields is finally in.
We believe they'll be wrong.
Our thesis is that this rally will ultimately be faded, with yields resuming their march higher.
Timing is everything: first the short squeeze, then the reversal.
We've been patiently waiting for this setup, and our entry may be arriving right on schedule.
The first move isn't always the real move.

The Bond Market Is Setting Up a Trap.
We've been anticipating a sharp rally in Treasuries, and the setup is getting closer.
A reversal in the 10-year yield could trigger systematic CTA short covering, forcing bond futures higher and accelerating the move.
The result? A powerful bond rally that convinces many investors the top in yields is finally in.
We believe they'll be wrong.
Our thesis is that this rally will ultimately be faded, with yields resuming their march higher.
Timing is everything: first the short squeeze, then the reversal.
We've been patiently waiting for this setup, and our entry may be arriving right on schedule.
The first move isn't always the real move.
10 yr has sold off 10% since this post.
Follow those with a history of getting it right.
Find out what is next.
Timing in this business is everything.


CTM Charts is coming together. 🔥
The goal: take the entire CTM systematic framework and make it visual, transparent, and easy to follow in one place.
Live strategy charts.
Entries & exits.
Market regime.
Signal state.
Trade history + performance analytics.
No digging through indicators or trying to interpret what the system is doing.
You open the chart and the entire playbook is right there.
Still building but this is starting to look exactly like what I envisioned for CTM.
Conquering The Markets. Systematic trading, simplified.

Proof we live in a stimulation and the funniest outcome is the most likely.
Remember when Bitcoiners went on a Tungsten campaign ...
Look what happened with price appreciation since.


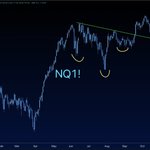
Inverted head and shoulders breaking out with authority.
The measured move points to roughly 33K on the Nasdaq.
But we’re going to need to see oil and the 10-year yield come down. Otherwise, this move could get violent to the upside and potentially even more violent on the downside afterward.

Touched and bounced off of the neckline resistance today.
Break above and it's on.
10-year threatens 5%. TIPS rising.
Those are my concerns.
Watch oil.
