

Tweets are not financial advice 👉 https://nitter.cf/t.co/P8YzisgMbq 👉 https://nitter.cf/t.co/ZZDR4ZjhrL
Joined May 2021
- Tweets13.8K
- Following169
- Followers6.9K
- Likes4.4K




Pinned Tweet
Join My Official Network Links:
📮Telegram
t.me/tradingpuzzles
📮Direct Contact
t.me/KlejdiCuni
📺Youtube
youtube.com/@TradingPuzzles
🐥Twitter
nitter.cf/TradingPuzzles
📈TradingView
bit.ly/3hwP4eJ
🌐Website
tradingpuzzles.net/
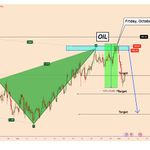
📣#OIL - Posted yesterday on 02-Nov-2026 📈
🎯Target_1 reached 🔥😁
📣Since Friday, October 30, 2026, the price has fallen by almost -9.4%.
Trump has commented many times since last week that the US and Israel will launch a major attack after the US midterm elections.
The worst part is that a nuclear attack is one of the options that Israel is asking the US for.
But what is really happening?
Oil fell by -9.4% at a time when it should have gone to the moon with all this bad news. Why is it falling?
Maybe something else could really happen and not a major attack?
This is just a crazy manipulated situation.
I think someone else already knows the truth in advance "Insider Trading", "Large Hedge Funds", Trump family etc.
This rapid sell-off that accelerated further yesterday at the opening of the US market is just a manipulation. Please be careful.
GOLD and OIL are moving against the news, which is not normal at all.
Many charts have been invalidated for no reason in the last few weeks.


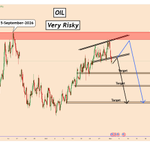
#OIL: A Movement Unrelated to War Developments
Currently, oil has fallen below $100 per barrel after the price tested a strong resistance zone near 105 - 106.8 degrees Celsius.
The current situation between the US and Iran remains very dangerous.
Trump threatened many times over the past week that the US and Israel will attack Iran after November 3.
However, there have been many reports that Trump also wants to reach a deal.
What is strange is that despite the conflict, oil has started to fall, indicating that manipulation remains high. If the US does not attack Iran after the US midterm elections, then oil may start to fall, as shown in the chart.
Downward targets:
97
94
90
You can find more details on the chart.
Thank you! 🍀
⚠️If the US and Israel launch a larger attack on Iran after November 3, we could see further increases in oil prices, but it is impossible to know how much they could increase because OIL remains a manipulated instrument.
⚠️PS: Do your own analysis and use your own strategy to join the trade.
#USOIL @tradingview #forex #forextrading #forexsignals #forexanalysis #futurestrading #future #brentoil #crudeoil

📣#NEAR: Head & Shoulders Signals Further Downside to 2.4
NEAR broke out of a large Head and Shoulders pattern. The pattern so far looks clear. Today will be a mess with the US midterm elections, so we need to be careful.
If NEAR moves near the neckline of the 4.30 pattern, it could be a good area to watch to sell NEAR.
If you already have it open, then hold it as it could fall further to 3.35 and 2.4.
You can find more details on the chart.
Thank you! 🍀
#crypto #cryptotrading #cryptoanalysis

📢The Strongest And Weakest Currencies at the Opening of the London Trading Session
🔴NZD is the strongest
🔴AUD is the weakest
#forex, #forextrading #ForexMarket #forexsignals #forextips #ForexEducation #goldtrading #goldsignals #goldanalysis #silversignals

🔈MARKET SNAPSHOT
S&P 500 Index Mini Futures: 7,565.00; down 0.13%; 9.5 points
DJIA Mini Futures: 51,928.00; down 0.39%; 205 points
Nikkei: 63,081.86; down 0.33%; 208.25 points
MSCI Asia, Ex-JP: 806.91; down 1.66%; 13.64 points
EUR/USD: $1.1194; up 0.06%; 0.0006 point
GBP/USD: $1.3415; up 0.06%; 0.0008 point
USD/JPY: 157.88 yen; down 0.04%; 0.06 point
Spot Gold: $3,923.95; down 0.59%; $23.47
U.S. Crude: $97.01; up 0.57%; $0.55
Brent Crude: $105.22; up 0.43%; $0.45
10-Yr U.S. Treasury Yield: 4.9145%; up 0.021 point
10-Yr Bund Yield: 3.2990%; up 0.0069 point
🗓 Economic Calendar - What to Expect Today 03-Nov-2026❓
🇯🇵BOJ has a public holiday today (public holiday)
🇨🇭CHF Consumer Price Index (Oct)
Swiss inflation is expected to reach 1.3% vs. 1% previos month. The monthly CPI is expected to remain unchanged at 0%. The impact remains unknown given that the CHF was strong these days for no reason and I think it was the SNB behind these moves.
🇺🇸US Midterm Elections
The focus will be on the US midterm elections and the potential impact on the USD.
Polls show that more than two-thirds of US voters say they are dissatisfied with the way President Donald Trump is handling inflation and affordability.
We might have an unstable and possibly weak USD.
🇳🇿NZD Employment Change (Q3)
Employment data from New Zealand will be released this evening. An improvement in the labor market is expected, but we will have to see what happens because the NZD has been undervalued for a long time and is most likely to start to strengthen slowly.
#forex #forexnews #forexmarket #forexanalysis

📣#EURUSD - Posted on 01-Nov-2026 📈
🎯Target_1 reached 🔥😁
✅EURUSD almost reached the second target. The price corrected again to 1.1180 but it should rise further again given that we have the US midterm elections.
#EURUSD @tradingview #forex #forextrading #forexsignals #forexanalysis #trading #investing

#EURUSD: Strong Support, Bullish Recovery on the Horizon?
EURUSD was rejected several times near 1.1115 - 1.1100.
On Friday we had some strange moves and EURUSD fell near 1.1140 on a day without news or data.
Given that we have the US midterm elections, they should bring uncertainty to the market regarding the future of the USD.
I think 1.1100 was a key area for EURUSD and it is very likely that it will move higher again although the risk associated with the US midterm outcome remains a hot topic.
Targets to watch:
Target 1: 1.1200
Target 2: 1.1250
You can find more details on the chart.
Thank you! 🍀
⚠️PS: Do your own analysis and use your own strategy to join the trade.
#EURUSD @tradingview #forex #forextrading #forexsignals #forexanalysis #trading #investing

Channel 5 - Investigating Jared Kushner's Empire of Fraud & Corruption
#albania #Albaniaprotest #flamingorevolution @Flamingo_TV

Investigating Jared Kushner's Empire of Fraud & Corruption
youtu.be/MM7QGccszUU


🚨#Gold Update
Gold started an aggressive move right at the opening of the US Market.
The price rose from 3895 to 3965 for no reason... no news that serves as a catalyst to increase the price and today we don't even have data on the economic calendar. So, Who created this optimistic move?
The same answer is "INSIDER TRADING" or "MANIPULATION"
Gold has already invcalidated many strong and clear setups for no reason lately... today which was clearly down, we can see gold rise.
Better stay away and forget about Gold for a while.
Fundamental and technical analysis were not in line after it was manipulated on that big crash.
Don't be fooled by the news agencies that Gold is moving down due to US treasury yields that are extremely high, expectations of a possible interest rate hike by the FED, or the Geopolitical situation. All of this news only supports a stronger Gold.
The US is literally in such deep shit with the current US Debt topic that none of the news agencies is talking about it. Why ?
Can gold rise further? I think yes but it could be risk as it might happen without any confirmation or a time that no one expects it to rise further.
All The Central Banks are adding gold reserves...so this fall it's just a manipulation. Everyone fears the Geopolitical and Economic situation that Trump created so none of the Central Banks will sell gold at the moment.
#gold #goldtrading #GOLDSIGNALS #goldanalysis #trading #investing #silver #silvertrading #silverinvesting #silveranalysis

🚨#GOLD
Only today gold fell nearly -2.6% from 4000 to 3891
The price found a very strong resistance zone near 4060 - 4070 that it was also the strongest zone. it couldn't manage to rise further and invalidated all the new bullish structure.
What it's very interesting it is not the fact that GOLD fell...it's the fact that didn't fall during FOMC meeting. Gold didn't fell after the ECB meeting.
But we see gold falling today when we don't have anything at all ...no news, or data.
If this is not "Insider Trading" or "Manipulation" then call it however you want.
Fundamental and technical analysis on GOLD are not working because this is just a manipulated situation. But this is only my opinion. These movements has nothing to do with normal technical analysis.
For the price to move is required a strong catalyst for such movements, not a news that was released days or weeks ago.
✅I didn't update gold yesterday and today as it wasn't clear what it was doing. I also advised my members to stay from GOLD. If something it is not clear then why we have to risk. It doesn't make sense.
🛑Please stay away from gold. This is my advise

#OIL: A Movement Unrelated to War Developments
Currently, oil has fallen below $100 per barrel after the price tested a strong resistance zone near 105 - 106.8 degrees Celsius.
The current situation between the US and Iran remains very dangerous.
Trump threatened many times over the past week that the US and Israel will attack Iran after November 3.
However, there have been many reports that Trump also wants to reach a deal.
What is strange is that despite the conflict, oil has started to fall, indicating that manipulation remains high. If the US does not attack Iran after the US midterm elections, then oil may start to fall, as shown in the chart.
Downward targets:
97
94
90
You can find more details on the chart.
Thank you! 🍀
⚠️If the US and Israel launch a larger attack on Iran after November 3, we could see further increases in oil prices, but it is impossible to know how much they could increase because OIL remains a manipulated instrument.
⚠️PS: Do your own analysis and use your own strategy to join the trade.
#USOIL @tradingview #forex #forextrading #forexsignals #forexanalysis #futurestrading #future #brentoil #crudeoil
🔈Binance says exit rush slowing down as users weigh security risk
Traders are keeping faith, for now, in the world's biggest cryptocurrency exchange after Binance was hit with a $6.3 billion heist, though larger investors are likely to turn cautious on crypto with security risks in sharper focus

#XRP Breakdown: Descending Triangle Signals Further Fall
RP broke out of a large descending triangle pattern.
For the price to fall further, it needs to hold strong below 1.2600.
Ever since Binance was hacked, the entire crypto market has been acting strangely. If investors panic and close open positions and withdraw their funds, XRP is likely to fall further.
Downward targets I’m considering for a short-term move:
1.205
1.1650
You can find more details on the chart.
Thank you! 🍀
⚠️PS: Do your own analysis and use your own strategy to join the trade.
#XRPUSDT @TradingView #crypto #cryptotrading #cryptoanalysis

📣The market is going crazy today.
I think these are the opposite movements to what we faced on Friday.
All the movements are happening for no reason, but they are moving the way the market should have moved after the big events we had the previous week.
#EURJPY Resumes The Uptrend
EURJPY broke out of an ascending accumulation pattern. The lowest price was reached at 175.10 and EURJPY took 8 days to complete this accumulation.
On the other hand, the Bank of Japan does not seem optimistic about further rate hikes, so the chances of EURJPY rising are increasing again.
Upward targets:
177.15
177.85
You can find more details on the chart.
Thank you! 🍀
⚠️PS: Do your own analysis and use your own strategy to join the trade.
#EURJPY @TradingView #forex #forextrading #forexsignals #forexanalysis #trading #investing

✅#DOT - Posted on 27-Oct-2026 📈
🎯Target_1 reached 🔥😁
✅PS: DOT tested the selling zone I explained and fell clearly. It's taking another pause but it can fall further gain

#DOT: Breaks Below Major Triangle
DOT broke out of a large Triangle pattern indicating increasing bearish momentum.
On the daily chart we can see that the price is only falling every day with a low momentum. A very good area we can watch to sell DOT could be near 1.04.
If you are in the trade, just keep it open as it has the potential to fall further to 0.94 and 0.83.
You can find more details on the chart.
Thank you! 🍀
⚠️PS: Do your own analysis and use your own strategy to join the trade.
#DOTUSDT @tradingview #crypto #Cryptotrading tradingview.com/chart/DOTUSD…

#NIKKEI: Bullish Harmonic Pattern Remains Intact
From our previous analysis, NIKKEI almost reached the first target in a quick manner, but faced a sell-off on Friday afternoon.
However, the movements during the afternoon occurred without any reason among forex, gold and many other instruments, so it was not a normal problem related to the index.
The price found a double bottom at this point near 61500.
If the market respects this support area, then NIKKEI should rise in a more clear way, otherwise we have to see how it can take shape.
I think the bullish movement remains intact for now.
Bullish targets:
65700
67700
You can find more details on the chart.
Thank you! 🍀
⚠️PS: Do your own analysis and use your own strategy to join the trade.
#NIKKEI @TradingView #indices #forex #forextrading #forexindices #forexanalysis
tradingview.com/chart/NIKKEI…

📢The Strongest And Weakest Currencies at the Opening of the London Trading Session
🔴EUR is the strongest
🔴JPY and NZD are the weakest
#forex, #forextrading #ForexMarket #forexsignals #forextips #ForexEducation #goldtrading #goldsignals #goldanalysis #silversignals
