
Data fan interested primarily in wastewater as it pertains to viral illness.
Palo Alto, CA
Joined January 2024
- Tweets175
- Following30
- Followers13
- Likes59


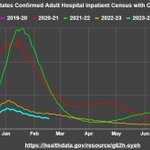
Jay, you may not have seen my original reply regarding Region 6, but I hope you see this follow-up.
I think I might have gotten this one right.
It also shows your intuition was good. The National uptick in admissions wasn’t real.


Dr. @michael_hoerger and Mr. @JPWeiland , what do you make of this pattern for Mass?
Do we assume infections really made a U-turn and increased by 116% during week of 1/27, or do we assume the wastewater readings are unreliable since COVID outcomes continued straight down?

1
1
202


It’s academic now.
We see the answer was #1: the wastewater readings were unreliable. COVID metrics are the better proxy.


97
CDC NWSS has now updated, and the artificial up-turn has disappeared as expected.
Specifically, the NE went from an increase to a decrease.
We already knew COVID outcomes had decreased rapidly. It was only the wastewater readings that were off-base.
Kudos to JP seeing clearly.


