

This is an archived account and is not being updated. For the latest updates follow @USGS.
- Tweets1.7K
- Following240
- Followers2.7K
- Likes61





ALT University of Alabama President, Stuart Bell, and Interior’s Principal Deputy Assistant Secretary for Water and Science, Michael Brain, cut the ribbon on the new USGS Hydrologic Instrumentation Facility. People holding the ribbon include members of University of Alabama leadership, state and federal representatives, and members of USGS leadership. Credit: University of Alabama.

ALT Photo of the front of the building with a USGS logo. Credit: University of Alabama.

ALT Photo of the inside of the facility. Credit: University of Alabama.


ALT A tile map of the U.S. showing streamgages by flow levels through the month of July 2024. For each state, an area chart shows the proportion of streamgages in wet, normal, or dry conditions. Streamflow conditions are quantified using percentiles comparing the past month’s flow levels to the historic record for each streamgage. During the month of June, wet conditions persisted for much of the Upper Midwest for states such as Minnesota and Wisconsin, while parts of the Eastern U.S. saw dry conditions for states such as West Virginia, Virginia, Massachusetts, and New Hampshire.


ALT Map of the continental United States showing records for corrected chlorophyll a and uncorrected chlorophyll a from phytoplankton (µg/L), based on threshold values: under (<10 µg/L), low (10–25 µg/L), moderate (25–50 µg/L), and high (>50 µg/L).


ALT A screen capture of a web mapping application. On the left side are workflow buttons. In the main panel is a watershed highlighted in yellow. Water flows from south to north. The outlet is marked with a blue pin flag. The basin is shaped like a kitten playfully lying on its back


ALT Photograph of the Snake River, Rocky Mountains, at 9,000 feet. We see a fast-flowing river with large rocks. The riverbanks are lined with trees.

ALT Image of drone flying over water. On top of the image is white line and dark blue space with text that reads “Drone-based mapping”. On the top left is a grey oval outlined in white with text that reads “Research & Development”. Text semi-centered over the image reads “Drone sensors could enhance stream mapping and monitoring”. The USGS logo is on the bottom right of the image.

ALT Image of drone grounded on a blue tarp in an area of dirt. On top of the image is white line and dark blue space with text that reads “Drone-based mapping”. On the top left is a grey oval outlined in white with text that reads “Research & Development”. On the bottom left of the image is text that reads “We are advancing the use of non-contact sensors to measure stream bathymetry.” The USGS logo is on the bottom right of the image.

ALT On a dark blue background, we see a turquoise illustrated river. Text on the image reads, “New Baseflow Forecast Tool. Find out how much water will be available if there is no rain. Download forecasts for thousands of locations across the US at usgs.gov/baseflow. Join us for a demo of the tool at our webinar on Thursday May 9th, 2 PM EDT.” We see a small screenshot of the Tool. The white USGS logo is in the bottom left.


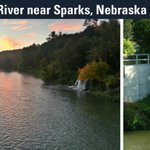
ALT Text reads: Niobrara River near Sparks, Nebraska (06461500). Left image: A colorful sunset reflects in a river. Trees line the right side of the river, and a waterfall can be seen. Right image: The circular gage housing sits atop grass and next to trees.


ALT A map of USGS streamgages and population density shows the proximity of gages to people. In addition, a line chart is overlaid showing the total population within 3 distances from any gage in the US. These distances represent a normal walking distance, biking distance, and driving distance. 6,731,533 people are within walking (< 2km), 106,186,269 within biking (< 6 km) and 299,932,698 within driving (<20km)