

Data-driven visual content focused on global trends, investing, technology, and the economy. 📲 Creator on @VoronoiApp
Vancouver, BC
Joined August 2011
- Tweets17.6K
- Following3.3K
- Followers367K
- Likes2.3K




Mapped: How Much People Spend on Food, by Country 🍽️
This graphic by @vizantano is one of the many incredible data-driven charts and stories from creators featured on our @VoronoiApp. ✅
voronoiapp.com/maps/What-Sha…

Visual of the Week 🥇
The U.S. is the world’s largest economy by nominal GDP in 2026, while China leads when adjusting for purchasing power.
visualcapitalist.com/the-wor…

Markets in Focus 📊
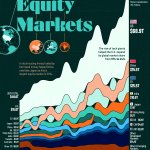
Where is the world's wealth concentrated, and how big have financial markets become?
From global stock market growth and the safest countries for investors to American companies valued higher than entire regions, explore the trends shaping global markets.
📩 Keep exploring with Visual Capitalist's free daily newsletter, covering markets, the economy, technology, and more.
visualcapitalist.com/subscri…


Mapped: Inflation Rates Around the World in 2026 🌍
visualcapitalist.com/mapped-…

Mapped: Each State’s Standout Halloween Candy 🍬
visualcapitalist.com/hallowe…

Mapped: Unemployment Rates Around the World in 2026 🌍
visualcapitalist.com/mapped-…

Ranked: Births vs. Deaths in 12 Major Countries 👶
This graphic by @JuliePeasley is one of the many incredible data-driven charts and stories from creators featured on our @VoronoiApp. ✅
voronoiapp.com/people/Births…

Ranked: The World’s Oil Reserves by Region 🛢️
visualcapitalist.com/ranked-…

Mapped: Political Ad Spending by U.S. State in 2026 🗳️
visualcapitalist.com/politic…

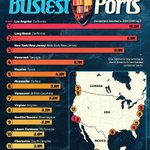
Ranked: North America’s 12 Busiest Shipping Ports 🚢
visualcapitalist.com/ranked-…

Mapped: Lifetime Property Taxes in Every U.S. State 🏠
visualcapitalist.com/mapped-…

Ranked: Countries With the Most Trust in Science 🔬
visualcapitalist.com/countri…

Mapped: Which Countries Pay the Most to the UN? 🌍
This graphic by Iswardi Ishak is one of the many incredible data-driven charts and stories from creators featured on our @VoronoiApp. ✅
voronoiapp.com/geopolitics/W…

Ranked: Countries With the Highest Online Gambling Rates 🎰
visualcapitalist.com/online-…

Ranked: The World’s Best Countries at Computing in 2026 💻
visualcapitalist.com/ranked-…

Ranked: The Economies Set to Grow Fastest in 2027 📈
visualcapitalist.com/ranked-…

Data centers are estimated to have raised U.S. wholesale power prices by 6.9% by 2025, with impacts varying sharply by region ⚡
Created in partnership with the @_NPUC, this graphic maps modeled wholesale power price impacts across 23 U.S. regions using data from the Federal Reserve Bank of Dallas.
visualcapitalist.com/sp/npuc… #npuc26

Ranked: Countries That Visit the Doctor Most Often 🩺
visualcapitalist.com/ranked-…

Ranked: The World’s Fastest-Growing Economies in 2026 📈
This graphic by Aneesh Anand is one of the many incredible data-driven charts and stories from creators featured on our @VoronoiApp. ✅
voronoiapp.com/economy/Ranke…

Ranked: The Most and Least Common Birthdays in America 🎂
visualcapitalist.com/most-co…
