

Quantifying mollusks with statistical significance
Wisconsin, USA
Joined October 2023
- Tweets366
- Following363
- Followers751
- Likes1.4K




updates to sports-leader-mcp v0.4.0
4 new tools: rankings, power index, team stats, futures
Fixes to leaders, win probabilities, standings, scoreboards
github.com/WalrusQuant/sport…

Made a couple other changes this morning.
sports-leader-mcp v0.5.0 is out
It adds 13 new tools for historical data going back to 2021 across MLB, NBA, NFL and NHL: games, box scores, player game logs, rosters, injuries, depth charts, lineups, weather and the daily bayesRatings team ratings.
github.com/WalrusQuant/sport…

updates to sports-leader-mcp v0.4.0
4 new tools: rankings, power index, team stats, futures
Fixes to leaders, win probabilities, standings, scoreboards
github.com/WalrusQuant/sport…
i started working on this site to focus my boredom while waiting for trade setups. this past week, i did a full redesign that i think turned out really nice. still more work to go on the team and player labs. would like to allow for more input from the user when creating one ratings and simulations. but its really coming along. has been a fun project. bayesratings.com
#ThisismyCrew !!!


a z-score tells you where a number sits in its distribution.
z = (x - mean) / sd
0 is the middle.
+1 is one standard deviation above.
a .600 record:
nba: z = +0.67
mlb: z = +1.30
baseball records bunch tighter, so the same record stands out more.
by raw win%, the 2022 dodgers (.685) trail the 2024-25 thunder (.829).
by z, the dodgers sit further from their league's middle:
dodgers +2.41
thunder +2.19
check the shape before the percentile lookup.
mlb run margins past 3 sd:
actual: 0.72%
normal curve: 0.27%

the full write-up, with the formula worked by hand and how a standard error is just a z: bayesratings.com/blog/z-scor…

z-scores are a metric i like to use when evaluating player performance in a position group. it allows you to put stats on different scales, like completion %, yards per attempt and epa per dropback, on one yardstick, so you can combine them without hand-picking weights. using data from nflverse, give your ai agent this prompt to pull the data, create metric-level z-scores, average them, and build your own composite rating system.

the number of bets you need depends on your price and your edge, not a round number like 1,000. a 4% edge at -110 needs about 2,260 bets before expected profit sits 2 standard errors above zero. at +300 it needs about 7,700. a 2% edge at -110 needs about 9,070.
price sets the noise on every bet, and the edge is squared in the formula, so halving your edge takes about 4x the bets.

the full write-up, with the formula and how to apply it to your own record: bayesratings.com/blog/sports…

wrote up the full breakdown: poisson vs negative binomial, nfl key numbers, and why monte carlo sims depend on the distribution you pick.
bayesratings.com/blog/skewne…

Adam retweeted

Back in 2025, Pat Murphy discussed the leadership and presence Christian Yelich brings to the @Brewers 🫡
“He leads this club. He's way more important than I am. Way more important.”
#WinOurWay

brier score is another way to grade a forecast. for each game you take the chance you gave, subtract what happened (1 if the team won, 0 if not), and square it. then average over every game. lower is better, 0 is perfect, and one game can never cost more than 1.
say you give a team 70% and they win: (0.7 − 1)² = 0.09. say you give them 90% and they lose: (0.9 − 0)² = 0.81.
calling every game 50/50 always scores 0.25, so that's the number to beat.
the useful part is that brier splits into three pieces:
- reliability: do your 70% calls actually win about 70% of the time. lower is better.
- resolution: do your forecasts move away from the average when they should. a forecaster who says 50% every game can be perfectly calibrated and still tell you nothing. higher is better.
- uncertainty: how often the team you're forecasting wins overall. it's 0.25 when wins are a 50/50 split, and it isn't up to you.
brier score = reliability − resolution + uncertainty
compared with log loss, brier is gentler on confident misses. a 90% miss costs 0.81 in brier and 2.30 in log loss. log loss cares most about the upsets you were sure wouldn't happen, and brier measures overall error. it's worth checking both.
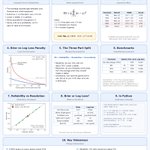
cheat sheet below, with the live bayesratings.com scorecard for reference

log loss scores how good your probabilities were, not just whether your pick won. each game you get scored on the chance you gave the team that actually won. if you said 70% and they won, the cost is small. if you said 90% and they lost, it's big (2.30 for that one game). lower is better.
the baseline is 0.693. that's what you score by calling every game 50/50, so a forecast has to beat it to be worth anything.
calibration asks whether your percentages come true as often as you said. if you give 100 teams a 60% chance, about 60 of them should win. if only 50 do, you're overconfident.
you need both. a forecast can be calibrated but vague, or bold but wrong. log loss rewards being confident and right at the same time.
cheat sheet below, with real nfl, nhl and mlb numbers from bayesratings.com


