

Behind the option dealer positioning curtain 🧙♂️ Options, vol, bat flips, dad jokes 🪄 Join us: https://nitter.cf/t.co/RBtTsngLeP 🧙♂️ Disclaimer: https://nitter.cf/t.co/TfWPx8wnhb
United States
Joined November 2017
- Tweets11.2K
- Following185
- Followers11.4K
- Likes4.2K



Pinned Tweet
The Most Accurate Way: The Volland Way
Recently, I issued articles that criticize the cottage industry of the dealer positioning services that use reductive assumptions, including GEX, open/close data, and midpoint analysis.
Someone asked me: if these methods are so wrong, then what is Volland’s method of determining dealer positioning?
Another person asked me: why should I care if my favorite method already works for me?
Both are fair questions.
The options industry has done a lot of work to increase transparency and education. There is a lot of data out there to accomplish many needs. As option volume increased, the data has also increased. Small institutions, non-quant institutions, and retail investors can easily get intimidated by this data, but that’s why Vol.land exists.
Volland’s data and studies are peer-reviewed and relevant, ensuring users have coherent and actionable data. For dealer categorization, this is our process:
/1

Good Morning! The AI trade continued to unravel as SPX dropped another -1.9%.
The selloff was mostly isolated to tech stocks, which fueled the NVDA-centric narrative. However, this selling should not come as a surprise to regular readers of this morning note. We have been talking about weakness that can culminate in a drop towards 7000 between Oct. and Jan, and it seems that is playing out. I thought it would be a violent drop, but it seems like intermittent vol crushes cause whipsaw. Why is that?
Read more on today's 𝑺 𝒖 𝒃 𝒔 𝒕 𝒂 𝒄 𝒌 post FOR FREE at wizardofops. s u b s t a c k. com

2
3
1,275
This is the SPX spot-vol correlation over the past 3 months, and there are two things to notice. The first is the Pearson coefficient (R2) is extremely high at .88. This is higher than I have ever seen the correlation between VIX and SPX.
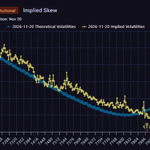
The second thing I notice is how high the slope of the line is. The average slope historically is about -1.2. We are looking at -2.05 right now, meaning we can expect a 2-point VIX advance for every -1% drop in SPX. If you look at the 30-day implied skew (1% drop on the 30DTE tenor in SPX), it is implying only a spot-vol correlation of -1. This means liquidity providers are exposed and are making up for it with violent real time skew adjustments. This will reduce the probability of a vol event and will create consistent whipsaw at least down to the 7000 target into Jan.
1
337
Volland's first futures tickers are now available: /ES, /NQ, /RTY, and /YM!
This begins our futures rollout, with more tickers to come.
Available on tiers Universe and Institutional.
The best in class options dealer positioning service just got even better.
vol.land

Nov, 16, 2026 - FUTURES TICKERS DEBUT - Market Moves with Volland: Dealer Positioning & Trade Strategies $SPX $QQQ $ES $Y $RTY $NQ #optionstrading #volatility #liveanalysis #marketdata #optiongreeks #trading #stocks #options #markets @darkmattertrade nitter.cf/i/broadcasts/2WXPoLoVP…

4
1,302
Good Morning! As the NVDA fallout continues, SPX dropped -.4%.
This is not a story that will be going away any time soon, as the US Government has stepped into the fray. This is all leading up to NVDA earnings on Tuesday after market close. The NVDA earnings outlook will be sent tomorrow behind the paywall, as I need to see today and tomorrow’s options flow.
This is opex week, and we still have an active vol event. Will that be satisfied?
Read more on today's 𝑺 𝒖 𝒃 𝒔 𝒕 𝒂 𝒄 𝒌 post FOR FREE at wizardofops. s u b s t a c k. com

Re-Run: Trader's Workshop | The Brew Ep. 522 nitter.cf/i/broadcasts/2ZBjgNmyX…

1,213
Good Morning! After NVDA lost their CEO, SPX dropped -.15%.
SPX had actually recovered from much steeper losses upon the open, as did NVDA. I’m sure we will learn more when NVDA presents earnings next week. The typical move is for NVDA to produce all the bad news in this next earnings call and outperform the presented worst-case scenario in all the earnings after that.
How sustainable is this market recovery?
Read more on today's 𝑺 𝒖 𝒃 𝒔 𝒕 𝒂 𝒄 𝒌 post FOR FREE at wizardofops. s u b s t a c k. com

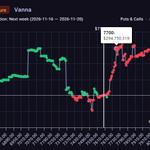
Again, seeing cumulative vanna exposure as a hill, next week’s curve looks slightly bullish, with resistance starting at 7650 and ending at 7700. That will make it tough to reach the 7690 vol event level. It might need a catalyst to get there, such as PPI or NVDA earnings. It will at least get close, however. The deadline is still 3 weeks away on 12/2. There is a chance it can reach after Nov. opex, but I will add to further tenor bearish positions when we reach those levels.
3
512
Good Morning! The tech rebound continues as SPX rose 1.3%.
This whole rally is happening despite every fundamental indicator pointing in the opposite direction. NVDA’s troubles have spread into a geopolitical crisis with China, undermining AI product exports and should have hurt the AI trade. The dollar is rising after FOMC rate hike odds increased for Dec, which undermine the whole market. Yet, the market persisted to the upside. Is it crawling up the “wall of worry”?
Read more on today's 𝑺 𝒖 𝒃 𝒔 𝒕 𝒂 𝒄 𝒌 post FOR FREE at wizardofops. s u b s t a c k. com

2
4
1,907
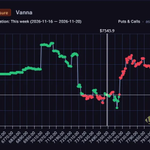
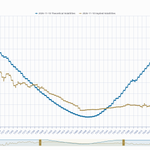
When you look at the cumulative vanna curve like above, the idea is to look at it like a hill. It is easier for price to roll down hills than climb up them. With the Nov. opex vanna looking erratic after the big Thursday drop, this week’s vanna has had a profound effect. It has shifted every day in accordance with the “hills”. The wall of worry is when puts are purchased by portfolios because they are scared of something, and this is what happened when we dropped last Thursday. For this week, the “bottom” of the wall of worry is at 7675, but 0DTE flow has yet to show up. Because the valley is so close to the vol event target, it might reach that target of 7690. This is a rally I am not playing because the swing thesis is for downside and IV has mostly run out of steam. 7675 is where I will reload shorts for Dec and Jan opexes.
3
510
Re-Run: Trader's Workshop | The Brew Ep. 521 nitter.cf/i/broadcasts/2gqkvqenR…

1
1,261
Good Morning! A hot CPI reading sank SPX -.4%.
First, Happy Veteran’s Day to everyone who serves their respective countries.
CPI came in quite hot yesterday, but in the midst of a vol event and supportive puts, it was difficult to move the markets down much further than they were. Vol collapsed to bounce markets off the lows. Is there more vol to crush?
Read more on today's 𝑺 𝒖 𝒃 𝒔 𝒕 𝒂 𝒄 𝒌 post FOR FREE at wizardofops. s u b s t a c k. com

3
6
1,877
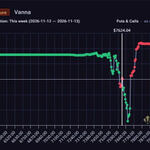
The answer is not really. Implied volatility is properly priced based on dealer holdings. There is a little bit more room for vol to drop, but this week seems like the last gasp of this deadcat bounce. Based on vanna readings, 7700 is an upside extreme, but current pre-market prices are already running into resistance.
2
548
Gamma doesn’t move prices in SPX anymore. It reshapes the entire volatility surface.
We tested how market maker gamma exposure affects 0DTE SVI-JW surface dynamics during periods of elevated realized volatility. The result: gamma has a statistically significant impact.
🧵 /1
#Options #0DTE #Volatility #QuantitativeFinance #Trading #MarketMakers #Gamma #Backtesting #Volland

Why it happens: Aggregate gamma is the largest outsized imbalance in options. In elevated realized volatility, it correlates with implied volatility on a 0DTE basis.
This is because in isolation, gamma is the most dangerous exposure an MM can have.
To hedge that gamma, liquidity providers change the quotes and quote sizes they offer, which changes the volatility surface. As a result, skew rapidly moves as liquidity providers protect themselves from gamma risk, while ATM IV tends to stay the same or decline.
/4
1
4
953
The trade: In wild markets, the data suggests buying at-the-money options and selling out-of-the-money options. Inverse butterflies would be a strongly positive return-to-risk trade.
Counterintuitively, one could also sell put verticals in negative gamma and negative charm 0DTE, and buy put verticals in positive gamma, positive charm.
This is the most interesting result of the study since it has become common knowledge that negative gamma increases volatility. That has changed with an increase in option volumes in SPX. With the added liquidity, dealers can now hedge gamma through volatility surface changes instead of through the underlying.
Full coefficient tables are in our white paper.
Full study: vol.land
/5
For what it's worth, the 7515 area is the top of that support area. The market will either break down towards 7425 or bounce toward 7550 and above. This is a critical price level, and I think a vol crush will lead it higher.


Good Morning! SPX bounced 2.35% in a vol crush rally.
The vol event target of 7690 doesn’t seem so out of bounds anymore! With SPX taking back over half of the drop from Thursday, this is not unrealistic scenario anymore. I maintain that this is a deadcat bounce to satisfy the vol event target, as stated for the past several days. What will the reaction be for after the CPI result?
Read more on today's 𝑺 𝒖 𝒃 𝒔 𝒕 𝒂 𝒄 𝒌 post FOR FREE at wizardofops. s u b s t a c k. com

1
11
1,993