

⭐ Verified Author @CryptoQuant_com | @Alphractal | @CoinMarketCap Crypto Analyst | On-Chain Research Market Structure & Liquidity UAE 🇦🇪
UAE
Joined April 2022
- Tweets13.6K
- Following896
- Followers2.3K
- Likes104K


Pinned Tweet
bitcoin:native: LTH Realized Supply Z-Score Nears Neutral
Bitcoin’s LTH Realized Supply 365-day Z-Score has fallen to roughly +0.33, down from a 2026 peak near +5 and a later rebound around +3.5.
The 365-day Z-Score tracks how far LTH Realized Supply sits from its one-year statistical norm. At +0.33, the metric is only modestly above that baseline, meaning the statistical excess behind the earlier 2026 expansion has largely faded.
Historically, negative readings have often appeared after elevated LTH supply conditions normalize, during repair, consolidation, and early-trend phases of the Bitcoin cycle.
A move below zero would not confirm a bull market. It would indicate that LTH Realized Supply has fallen below its trailing 365-day norm — a condition observed in both constructive and sideways market environments.
Key takeaway:
The 2026 LTH Realized Supply expansion has largely normalized. A move below zero would complete that reset and, in the current STH repair context, would lean constructive — provided demand keeps confirming it.


Zizcrypto retweeted
ethereum:0x6982508145454ce325ddbe47a25d4ec3d2311933: 3-Month Liquidation Map Shows Long-Heavy Structure
@Alphractal 3-month ethereum:0x6982508145454ce325ddbe47a25d4ec3d2311933 liquidation map shows a strongly long-heavy setup: roughly $940M in long-liquidation exposure, or 83% of the map, versus about $193M on the short side.
1000PEPE is trading near $0.00510. The nearest short-liquidation clusters are concentrated around the $0.00539–$0.00541 area, while additional upside liquidity extends toward $0.0057–$0.0061.
The nearest downside long cluster sits around $0.0050, where the first nearby long-cascade risk is concentrated. If that area fails, deeper downside liquidity toward the $0.0037–$0.0035 area comes back into focus.
Alphractal’s cascade view shows roughly $70.9M across the four largest downside clusters, versus about $31.1M across the four largest upside clusters.
Key takeaway:
The 3-month ethereum:0x6982508145454ce325ddbe47a25d4ec3d2311933 liquidation structure is tactically two-sided, but the broader risk remains weighted toward long liquidations. Upside liquidity is visible relatively close to spot and again toward $0.0057–$0.0061, while the larger liquidation exposure remains concentrated below — leaving the setup vulnerable if the current move fails to hold.


ethereum:0x6982508145454ce325ddbe47a25d4ec3d2311933: 3-Month Liquidation Map Shows Long-Heavy Structure
@Alphractal 3-month ethereum:0x6982508145454ce325ddbe47a25d4ec3d2311933 liquidation map shows a strongly long-heavy setup: roughly $1.2B in long-liquidation exposure, or 83% of the map, versus about $241M on the short side.
1000PEPE is trading near $0.00453. The nearest short-liquidation clusters are concentrated around the $0.00470–$0.00484 area, while the larger upside level sits around $0.0054.
The larger downside cluster sits around $0.0040–$0.0038, where the main nearby long-cascade risk is concentrated. If that area fails, deeper downside liquidity toward the $0.0032–$0.0030 area comes back into focus.
Alphractal’s cascade view shows roughly $80.4M across the four largest downside clusters, versus about $24.4M across the four largest upside clusters.
Key takeaway:
The 3-month ethereum:0x6982508145454ce325ddbe47a25d4ec3d2311933 liquidation structure is tactically two-sided, but the broader risk remains weighted toward long liquidations. Upside liquidity is visible relatively close to spot and again toward $0.0054, while the larger liquidation exposure remains concentrated below — leaving the setup vulnerable if the current move fails to hold.

Zizcrypto retweeted

The US votes in the midterms today.
Bitcoin was higher 12 months after every midterm since 2010: 4 of 4, median +63%.
But midterms run on a 4-year clock. So does Bitcoin's halving cycle.
That changes how to read the record. A thread 🧵

Zizcrypto retweeted

Positioning shifts. Liquidity moves. A thesis evolves.
We built Alpha Terminal to bring Alphractal’s market intelligence and trading into one place. Where your view becomes a position.
For alphas who look beyond price.
More soon.
🤖 Made with AI

Zizcrypto retweeted

The truth is, this is simply a natural wave of mass long liquidations!
The headlines and fearmongering are designed to push you into realizing your losses, feeding exchanges and liquidity-hungry whales.

Today's sell-off is simply a mass liquidation event!
News and narratives are flying in every direction, but the reality is that the crypto market is heavily leveraged.
Cut through the noise with data.
Access the best crypto analytics tools now at Alphractal.com.

ethereum:0x6982508145454ce325ddbe47a25d4ec3d2311933: 3-Month Liquidation Map Shows Long-Heavy Structure
@Alphractal 3-month ethereum:0x6982508145454ce325ddbe47a25d4ec3d2311933 liquidation map shows a strongly long-heavy setup: roughly $940M in long-liquidation exposure, or 83% of the map, versus about $193M on the short side.
1000PEPE is trading near $0.00510. The nearest short-liquidation clusters are concentrated around the $0.00539–$0.00541 area, while additional upside liquidity extends toward $0.0057–$0.0061.
The nearest downside long cluster sits around $0.0050, where the first nearby long-cascade risk is concentrated. If that area fails, deeper downside liquidity toward the $0.0037–$0.0035 area comes back into focus.
Alphractal’s cascade view shows roughly $70.9M across the four largest downside clusters, versus about $31.1M across the four largest upside clusters.
Key takeaway:
The 3-month ethereum:0x6982508145454ce325ddbe47a25d4ec3d2311933 liquidation structure is tactically two-sided, but the broader risk remains weighted toward long liquidations. Upside liquidity is visible relatively close to spot and again toward $0.0057–$0.0061, while the larger liquidation exposure remains concentrated below — leaving the setup vulnerable if the current move fails to hold.
ethereum:0x6982508145454ce325ddbe47a25d4ec3d2311933: 3-Month Liquidation Map Shows Long-Heavy Structure
@Alphractal 3-month ethereum:0x6982508145454ce325ddbe47a25d4ec3d2311933 liquidation map shows a strongly long-heavy setup: roughly $1.2B in long-liquidation exposure, or 83% of the map, versus about $241M on the short side.
1000PEPE is trading near $0.00453. The nearest short-liquidation clusters are concentrated around the $0.00470–$0.00484 area, while the larger upside level sits around $0.0054.
The larger downside cluster sits around $0.0040–$0.0038, where the main nearby long-cascade risk is concentrated. If that area fails, deeper downside liquidity toward the $0.0032–$0.0030 area comes back into focus.
Alphractal’s cascade view shows roughly $80.4M across the four largest downside clusters, versus about $24.4M across the four largest upside clusters.
Key takeaway:
The 3-month ethereum:0x6982508145454ce325ddbe47a25d4ec3d2311933 liquidation structure is tactically two-sided, but the broader risk remains weighted toward long liquidations. Upside liquidity is visible relatively close to spot and again toward $0.0054, while the larger liquidation exposure remains concentrated below — leaving the setup vulnerable if the current move fails to hold.

bitcoin:native: Bubble Risk Cools as MoM Turns Negative
@Alphractal Bubble Risk (MoM) has moved below zero to approximately -0.07, while Bitcoin trades near $80.5K.
The underlying Bubble Risk measure has eased to 1.238, down from 1.273 a week ago and 1.336 at the October 4 local peak.
The negative MoM reading reflects a decline in Bubble Risk over the 30-day comparison window, not a low absolute risk level.
This points to moderating speculative excess from earlier this month, without implying that overheating risk has disappeared.

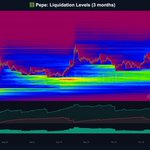
🚨 @hyblockcapital Liquidation Levels $PEPE 🚨
⚠️ Repost to keep the @pepecoineth community up to date ⌛️

🚨 @hyblockcapital Liquidation Levels ethereum:0x6982508145454ce325ddbe47a25d4ec3d2311933 🚨
⚠️ Repost to keep the @pepecoineth community up to date ⌛️

Zizcrypto retweeted
Every Bitcoin cycle has taken longer to recover to its all-time high than it took to fall into the bear market.
We're only ~100 days into this recovery. @cryptovizart walks through what the historical ratio implies.
Watch now ⤵️
youtu.be/U-I_qW-3OzA

Zizcrypto retweeted
The crypto derivatives market has undergone a massive structural transformation.
Bitcoin once controlled over 90% of Open Interest. Today, altcoins dominate with 57.4%.
Think about what this means: leverage, speculation, and liquidation risk are no longer concentrated primarily in Bitcoin.
The next major wave of volatility may not start with Bitcoin. It could start with altcoins and spread across the entire market.
This is exactly why we built Alphractal: to understand what is happening beneath the surface of the market.
Bitcoin once dominated the crypto derivatives market, accounting for over 90% of total Open Interest. That landscape has changed dramatically.
Analyzing data from 30 of the largest crypto exchanges, altcoins now account for 57.4% of total Open Interest, while Bitcoin represents 42.6%, a difference of 14.8 percentage points.
This structural shift shows how derivatives exposure has expanded beyond Bitcoin, making altcoins increasingly important in understanding market volatility, liquidity dynamics, and liquidation risk.
Bitcoin alone no longer tells the full story of the crypto derivatives market.
Alphractal.com


bitcoin:native: Price Trades Above Rising 200DMA, Below Overbought Zone
Bitcoin is trading near $82.7K, around 14% above its rising 200DMA baseline near $72.5K, while remaining below the 1.5× overbought valuation band near $108.7K.
A retest of — or even a temporary move below — a rising 200DMA can remain compatible with a broader bull-market structure and does not, by itself, imply a bearish regime shift. This differs from sustained trading below a falling 200DMA, which would indicate a materially weaker long-term trend condition.
The 1.5× band is a valuation reference — not a price target. It marks elevated extension relative to the 200DMA: BTC can reverse before reaching it or remain above it during strong momentum phases.
Key takeaway:
A temporary move below a rising 200DMA matters less than persistent trading below it while the average flattens or turns lower.

🚨 @hyblockcapital Liquidation Levels ethereum:0x6982508145454ce325ddbe47a25d4ec3d2311933 🚨
⚠️ Repost to keep the @pepecoineth community up to date ⌛️

bitcoin:native: STH Cost Basis Rises as Retest Remains Open
In the September update, BTC had reclaimed the Short-Term Holder Realized Price. The open question was whether price would return to that level and hold it as support.
That retest has not happened. The STH Realized Price has since risen to roughly $73.5K, while BTC is trading around $83K — about 13% above the recent-buyer cost basis.
STH Supply in Profit has cooled to around 74%, down from the 85–97% readings seen after the rebound. Most short-term holder supply therefore remains in profit while BTC continues to trade above its cost basis.
If price later returns toward $73.5K, that would be the support test. Holding that level would matter more than the fact that price has stayed above it so far.
Key takeaway:
The STH cost basis has risen to roughly $73.5K, while BTC remains about 13% above it and around 74% of short-term holder supply is still in profit. Whether $73.5K holds can only be tested if price returns to it.

bitcoin:native: STH Cost Basis Reclaimed, Retest Now Matters
In the August update, STH Supply in Profit had recovered to 52%, but BTC was still trading near $64K — roughly 6% below the STH Realized Price around $68K. Cost-basis confirmation was still missing.
That constraint has now flipped. On September 3, BTC traded near $81.3K versus an STH cost basis around $70.4K, while STH Supply in Profit reached about 97%.
After the pullback toward $77K, BTC remains above the updated STH Realized Price near $70.9K, with short-term holder profitability still broad at around 85%.
The reclaim is a constructive shift, but not full regime confirmation by itself. The next test is whether BTC can retest the STH Realized Price and hold it as support.
Key takeaway:
The August gap has closed: bitcoin:native is back above the recent-buyer cost basis, and STH profitability remains broad. Confirmation now depends on a successful retest and hold above the STH Realized Price, not on the reclaim alone.
