

FOSS Bitcoin data suite for everyone built by: @_nym21_ editor in chief: @darkfost_coc supported by: @opensats
on-chain
Joined September 2026
- Tweets113
- Following5
- Followers575
- Likes208




Pinned Tweet
Live Bitcoin data, right inside @claudeai.
bitview has an MCP server: read-only tools for blocks, txs, addresses, mempool, mining and on-chain metrics.
No sign-up. No API key. Free forever.
mcp.bitview.space
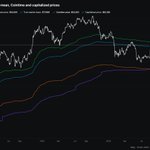
After being rejected at the Capitalized Price zone, estimated at $82 100, Bitcoin was pushed back toward the True Market Mean, located at $77 600.
Since the start of 2026, the Capitalized Price has continued to be seen as an exit point by the least well-positioned or most impatient investors, who can no longer bear to see their capital at a loss.
Unlike the True Market Mean, a supply-based model, the Capitalized Price takes into account the amount of capital invested at a given price.
Bitcoin is therefore caught between two zones of interest, one defined by the most active investors, the other by invested capital.
Chart Link : next.bitview.space/studio/#c…


And bitview.space is redesigned, still a work in progress: Studio to chart any series, Compass for where the market stands, Oracle for the price read from the chain alone, plus a series browser, a mining globe and calendar, and live server logs.
6/7
Reply here if an id you rely on is missing from bitview.space/changes, or if anything looks off.
7/7
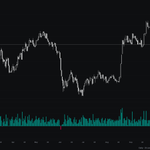
On a 24-hour basis, Bitcoin’s return on investment has hit -4.5%.
Anything beyond -4% is an extreme for a single day. Since the start of the year, only 8 days have been this negative or worse.
The last times the market saw such negativity were in February and June, when bitcoin:native was testing the $60 000 zone.
Chart Link : next.bitview.space/studio/#c…

Bitview retweeted

new compass update: added one final config (new default), where clouds use averages in addition to 40%-60% percentiles (previous default) which slightly improves the overall repartition of moods
every mood now feels right when looking at what the price was at the time
would love to hear some things from fellow analysts


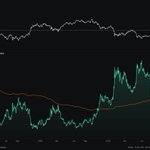
The Rarity Meter is an indicator that is fairly simple to read and makes it easy to gauge BTC’s valuation.
It is a rather conservative model that removes the most extreme outliers in order to provide valuation bands by percentile.
The highest bands represent unusually high valuations, while the lowest bands represent the zone of deep undervaluation. bitcoin:native is currently sitting at the median, the soft middle, which leaves investors still hesitant.
Note that this bear market bottomed at the 2nd percentile, so it was much less undervalued than the last bear market. This makes for a rather interesting long-term read.
Chart Link : next.bitview.space/studio/#c…

Bitview retweeted
finally gave a proper upgrade to the aging sentiment/signal pages
new compass available at next.bitview.space/compass


The halving is a major event for Bitcoin and its miners, as it cuts mining rewards in half.
It occurs approximately every four years, or every 210 000 blocks.
Today, there are roughly 76 000 blocks left until the next halving. With an average of 144 blocks mined per day, that leaves around 527 days until the next halving, sometime in April 2028.
BTC has tended to perform well after each halving, although during the latest cycle, it reached a new all-time high before the halving itself.
If we compare BTC’s performance between halvings, we can see that the returns have gradually declined :
Before the 1st halving : 201.2x
2nd halving : 54.1x
3rd halving : 13.3x
4th halving : 7.4x
5th halving to date : 1.2x
The return for this latest halving still seems very modest, but as mentioned, bitcoin:native still has 527 days to do better...
Chart Link : bitview.space/studio/presets…

