

Crypto Trader since 2020 | Daily $BTC Analysis and Trade Ideas | NFA DYOR | Trader at: @vantagetradingac 👀 DM for discord access
In the trenches
Joined February 2025
- Tweets3.7K
- Following41
- Followers6.4K
- Likes2.4K




$BTC
So far these two fractals look almost identical.
The only thing that is noticeably different is the timespan in which this larger correction took place.
Back in 2023, price established a higher high around $25k and then proceeded to dump roughly 22% over the next 22 days.
This time, we’ve so far seen a pullback of roughly 12% from the local top within 40 days.
Considering that cycles continue to evolve and drawdowns generally become less severe as the market matures, I wouldn’t expect another correction this deep.
Instead, what I think is most likely is a short deviation below the previous low around $75k, followed by a strong impulse to the upside.

$BTC
Interesting.
Looking at the past four monthly opens, we can see that they all played out in a very similar way.
First, price trended lower into the monthly close, which was then followed by an inverse move right after the start of the new month.
Those reversals produced an average move of roughly 7% to the upside within the first few days after mO.
This time around seems to be no different.
We are once again seeing a slow bleed ahead of the monthly close, and if this pattern continues to play out, we could see a move back into the $80k region over the course of next week.

$BTC
The path is clear. We just have to stay patient.
Due to the recent selloff, the majority of downside liquidity has now been taken out.
On the upside, however, huge amounts of fresh liquidity have built up that will sooner or later get targeted.
For now, we just have to stay patient and wait for selling pressure to fade before buyers can start pushing price back up.

$BTC
A sweep of $75k seems quite likely.
Back in September, we saw the previous leg up where price pushed into the yearly open region, rejected and
left behind equal highs right around $87k.
Since then, price is down roughly 12% from the local top and has now broken below our key support level at $79k.
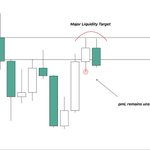
Considering that the pmL remains untouched and this monthly candle is likely to close below support, a sweep of this low becomes increasingly likely.
A potential scenario I’m therefore observing is that we see another dump right at the monthly open where price briefly deviates below $75k, followed by a bounce back into the $80k region.

$BTC
No signs of strength yet.
Both spot and futures CVD continue to trend lower, suggesting that sellers are still in control.
For a sustainable bounce, I would like to see spot demand pick back up while futures selling starts to fade.
If that doesn’t happen, downside pressure will likely continue and a sweep of $75k remains quite possible.

$BTC
$77k-$79k liquidity cluster swept ✔️
As expected, we first saw the anticipated bounce from the ascending trendline, followed by a sweep of the local highs.
Shortly after, price sold off aggressively, breaking below our key level around $80k and tapping into the lows of the previous range.
This is the area BTC now needs to hold. Otherwise, a deeper pullback into the low $70k region or even towards the previous ATH at $69k becomes possible.
I’m expecting this area to hold, which is why my overall thesis hasn’t changed.
I still think we’ll see BTC trading above $90k this year, but for now, we just have to endure this capitulation.

$BTC
Everything is pointing towards another expansion to the upside.
Price has now swept the lows several times while leaving behind multiple untouched highs.
For the past week spot has already started accumulating heavily again while perps are getting overly aggressive trying to push price lower.
At the same time sentiment remains completely bearish and people keep calling for lower prices.
These are exactly the type of conditions you see before another leg up.
I’m now positioned in two swing longs with $BTC and $SOL and remain confident in my thesis.
Let the games begin 🎲

Caught this short on $XRP earlier today.
I share setups like this, together with my market analysis and reasoning, inside our Vantage Discord server.
DM me “ACCESS” if you want in.

$BTC
Short squeeze incoming.
While BTC has been consolidating around the lows for roughly one week now, spot has been accumulating the entire time.
At the same time, open interest has been building up while futures CVD continues to move lower.
This suggests that perps have been aggressively opening new short positions, preventing price from moving higher.
As long as spot demand stays intact, I believe it is only a matter of time before these shorts get squeezed and help fuel the next aggressive move to the upside.

$BTC
Yesterday’s pump leading up to FOMC turned out to be a typical fakeout.
Price rejected from the $82k area and retraced the entire upside move we saw ahead of this news event.
So far, BTC is still respecting the ascending trendline and hasn’t swept any of the lows just yet.
I believe that one more short-term bounce from here is possible to fill some of the imbalance that was created on this sharp retrace, but ultimately, I believe we will continue lower and take out some of the liquidity between $79k and $77k.

$BTC
Further upside is just a matter of time.
Although there is still one significant cluster of long liquidations left between $79k and $77k, I don’t think it necessarily has to get taken out.
However, if we do get a sweep into that region, I will use that chance to increase my spot position and add further to my already running swing long trade.
I believe this area will most likely offer the best buying opportunity we get for the rest of this cycle, so make sure to take advantage of it.

$BTC
The stage is set for the next leg up.
Ahead of the last two FOMC meetings, we had an extended period of slow bleed followed by a major expansion to the upside.
Over the past three weeks, price has once again been slowly grinding lower from $87k all the way down to $79k.
The setup is starting to look very similar.
If history repeats itself and FOMC once again acts as the catalyst, this could be the move that finally sends BTC out of this range and starts the next major expansion higher.

$BTC
No real signs of weakness yet.
Price is currently pulling back sharply despite some strong spot demand.
Meanwhile, open interest remains relatively flat while futures CVD has started declining.
This suggests that most of the current selling pressure is coming from perps while spot continues to accumulate throughout this move.
As long as spot demand stays intact, I wouldn’t be too concerned about this pullback just yet.
However, spot demand needs to stay intact or else downside momentum could quickly accelerate and turn this into a cascade lower.

$BTC
The scenario I talked about yesterday is now coming into play.
Price has swept the local highs around $81k and is currently trading slightly above our key resistance zone.
For bullish continuation, I want to see buyers hold price above $81.3k into the upcoming 4H close.
In that case, we could see a push towards our short term liquidity target around $82k.
If sellers, on the other hand, step back in and BTC fails to close above the grey zone, there’s a decent chance that the downtrend continues and we target the unswept lows around $79k next.

$BTC
I just don’t get it.
Price is down roughly 10% from the local top and current levels already offer a great buying opportunity.
And yet people are still fixated on getting a 3-5% better entry.
Instead of using this chance to build their position and scale further into it if price continues lower, they risk staying
sidelined because they’re trying to snipe the exact local bottom.
Personally, I would never take that kind of risk, considering that a year or two from now, when BTC is trading at a new ATH, nobody is going to care whether you bought at $80k or $75k.

$BTC
Looks like there is some strong buying interest between $78k and $72k.
On the upside, however, asks remain basically nonexistent.
This is exactly the kind of combination you want to see. Buyers who are willing to step in on any dip while selling pressure is relatively weak in comparison.
I still believe that overall, further upside is favored and that we will soon see the next leg up, whether there is another small pullback first or not.

$BTC
Don’t get baited into a false breakout here.
Price is currently grinding its way back up towards our key resistance level around $81k.
However, with FOMC tomorrow, I wouldn’t expect a breakout just yet.
Price often remains choppy ahead of major events like this and hunts liquidity on both sides while the larger move tends to happen afterwards.
That’s why I could see BTC sweeping the local highs around $81k before rejecting from this area once again and targeting the unswept lows around $79k next.

$BTC
Short squeeze incoming.
Price is slowly grinding lower while spot has started accumulating again.
Open interest, on the other hand, is building back up while futures CVD continues moving lower.
This suggests that despite some decent spot demand, perps are currently pushing price lower.
We saw a very similar pattern right before price pumped towards $85k last week and shorts ended up getting rekt.
If spot demand stays intact, we could see something similar happen soon.

This is probably one of the most interesting charts right now.
USDT.D is currently sitting at a key monthly support level, and considering that it tends to move inversely to $BTC,
what happens here could be crucial for the upcoming months.
If this support continues to hold and USDT.D bounces again, BTC could see a significantly deeper pullback than most people are currently expecting.
We saw something similar during the previous cycle, where BTC broke out of its bottoming range before pulling back sharply to retest the previous ATH and only then continuing higher.
A similar retest this time around would put BTC back near the $69k region.
That’s a scenario I wouldn’t rule out as long as USDT.D continues to hold this support.
If USDT.D loses this level instead, that would be an extremely bullish development for BTC and could set the stage for the parabolic phase everyone has been waiting for.

$BTC
Things are not looking too bullish.
BTC remains below a key resistance level with a few unswept lows still sitting below price.
From here, I could see one more push towards $81k to sweep the local highs before reversing and targeting those lows next.
As long as $81k remains resistance, I would favor this scenario and potentially even further downside afterwards.
A reclaim of $81k would shift my short term outlook and open the door for a move towards $82k, followed by $82.9k-$83.5k if momentum continues.
