


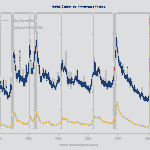
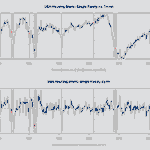

Initial claims shocked me this morning. I was expecting a continued trend in the 260ks. While looking deeper, I found a couple additional measures of employment data that might be helpful. 1. Average Weeks Unemployed and 2. Percent unemployed receiving benefits.


If we use that as a basis, many of these current unemployed workers are still receiving benefits. However, those unemployed for longer than 26 weeks likely are not receiving any benefits. The good news is this is a low percentage, 19.8%, but it is rising.


Initial Claims are unchanged at 264K vs. 264k revised prior. However, continued claims have been falling since April 1,861 vs. 1,759 now.

Single Family starts and permits rebounding. It will be interesting to see how this shows up later in the week in the Conference Board leading economic indicator.


NY Empire Manufacturing Survey is still different than the Philly survey. NY activity increased from -31.8 to 6.6, while Philly decreased from -10.4 to -13.7. Employment remained the same while prices declined in NY but remained unchanged in Philly. Manufacturing is stuck.


On Wednesday we received data on the total amount of borrowing by banks from the Fed. It peaked March 22nd at 296B. Is it all clear in the banking sector? Maybe too soon to tell with rate hikes still on the table. Watch for today's H.8 data release to see deposit flows.

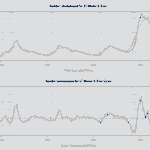
After this morning's surprise in Jobless Claims (+24k above consensus), we have to note that the labor market is cooling faster than anticipated. This is further evident by yesterday's Kansas City Fed Labor Market Indicator which declined for its seventh consecutive month.


Grant Collins retweeted

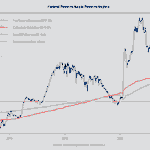
The current market vibe—small caps making new relative lows, while large caps appear to be breaking out—is not typically a bullish sign, but there are exceptions. There was a similar vibe with the 1998 low. We all know what happened next.


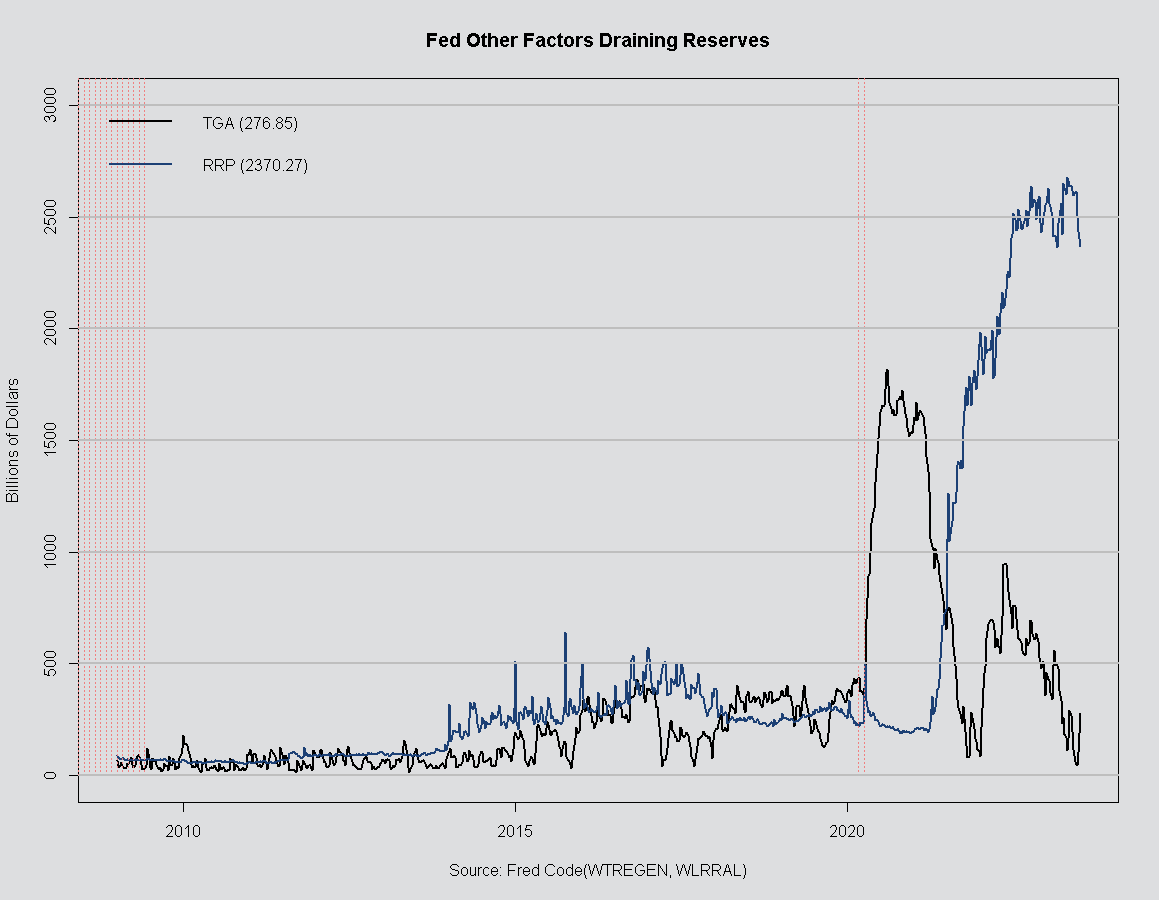
Despite QT reserves increased by 69 billion last week. This shows that the Fed still has room between the floor of reserves, which leaves the door open for continued QT. With uncertainty around rate increases maybe the Fed should pause and just continue QT.

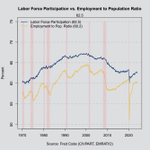
Powell's preferred labor market indicator just moved up. The peak looks to be March of last year. However, the rate of this decline is slow. The trouble with this is what ratio is ideal? 1 to 1?

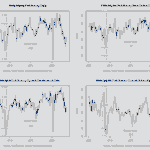
After the Dallas Fed Manuf. Survey reported I updated my composite with NY and Philly. You can see general business activity continues to slow, new orders dropped, and employment held steady while prices continued to deflate. Would expect to see this in the ISM report tomorrow.

Yesterday the AAII Bull/Bear Investor Survey data was released. Those surveyed still registered a net bearish outlook with a % bearish at 39%. However, net bullish improved slightly to 27%. The bull/bear Ratio remains low at 0.69.


The Philly Fed's survey of professional forecasters was released today. Forecasters see below trend growth at 1.3% for 2023. The forecasters also see recession risk rising in the second half of this year and early 2024.
philadelphiafed.org/surveys-…
These moves in the short-term funding market continue to catch my eye. The one month has exceeded the Fed's upper band of 5.25%. The spread between 3mo&1mo paint a picture of increased volatility. Pair this with the SLOOS, and it looks a little "crunchy"

