

Where structure, liquidity & human error converge. Est. ’16 @AlienTradingLab | Premium Discord ↓
Outlier
Joined March 2022
- Tweets13.6K
- Following51
- Followers22.2K
- Likes21.1K





Billions stolen.
Fed on the mic.
Alts barely blinked.
Decoupling isn't coming. It's here. Watch where the money flows, not where the headlines point.
Called the $BTC rally in July. Called it a fake bull too.
Now it's back at the weekly MAs. Hold them, or roll over like the map says?

$BTC
𝗧𝗵𝗲 𝗵𝗶𝗴𝗵𝗲𝗿-𝘁𝗶𝗺𝗲𝗳𝗿𝗮𝗺𝗲 𝘀𝘁𝗿𝘂𝗰𝘁𝘂𝗿𝗲 𝗿𝗲𝗺𝗮𝗶𝗻𝘀 𝘄𝗲𝗮𝗸.
Still, I believe the most unexpected path for 2026 may also be the most logical: a convincing bullish rally above the weekly moving averages, strong enough to rebuild optimism and make the broader weakness appear resolved.
𝗠𝘆 𝘁𝗵𝗲𝘀𝗶𝘀: 𝗮 𝗳𝗮𝗶𝗹𝗲𝗱 𝗯𝘂𝗹𝗹𝗶𝘀𝗵 𝗯𝗿𝗲𝗮𝗸𝗼𝘂𝘁.
A temporary reclaim of the weekly MAs, followed by rejection and acceptance back below them, then the capitulation phase.
Only after that would I begin looking for a genuine higher-timeframe reversal in 2027.
𝗕𝗼𝗼𝗸𝗺𝗮𝗿𝗸 𝘁𝗵𝗶𝘀.
We’ll revisit the roadmap as we enter 2027.

Last time Binance froze withdrawals after a hack was May 2019. 7,000 BTC gone from a hot wallet.
Here's how it played out:
1. Deposits and withdrawals frozen. Trading kept running.
2. Security rebuilt from the ground up. API, 2FA and withdrawal checks, the exact gaps the hackers used.
3. A full maintenance window. Every service offline.
4. Back online with a cancel-only window first, so stale orders didn't fill at prices nobody wanted anymore.
5. Deposits, then trading. Withdrawals right after.
6. SAFU covered the entire loss. Users didn't eat a single coin.
7. The market shrugged it off. Not just $BTC, the whole market. Total crypto market cap ran 125% in Q2 2019, hack and all.
Start to finish: about 8 days.
This time the number has a B on it, not an M. Same playbook, bigger bill.
We'll see if history rhymes.


$SOL update: tagged the STH at 125 and rejected. Step one, done.
101-84 can give us the bounce. One more leg down, and the grey zone is where I look for the reversal.
Still not getting ahead of the chart.

$SOL HTF outlook:
A rejection at the STH followed by a rotation back into the grey zone remains my base case.
For bullish continuation, the marked TS low needs to hold. Until the red-marked high is reclaimed, there is no reason to get ahead of the chart.

3 months of +5%: $10,000 becomes $11,576.
Then one loss stings. You size up 5x to win it back. Three trades, three stops.
$9,925.
3 good months. 1 bad afternoon.

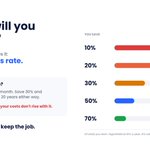
Your income doesn't decide when you're free.
Your savings rate does.
Save 10%: free in 33 years.
Save 30%: 20 years.
Save 50%: 13 years.
Spend the raise, keep the job.

Trader A makes +2% every month.
Trader B makes +20%, then −15%, on repeat.
B averages more. A ends the year with $12,682. B with $11,262.
Average returns lie. Smooth beats exciting.


