




Pinned Tweet
Our Last Month (September) Trading Recap.
Total Signals: 139
T/P Reached: 112
S/L Reached: 12
Closed: 05
Running: 00
Invalid: 10
Success Rate: 91.37%
Total PnL: +13189%
Join our premium and start growing your portfolio with Alpha Crypto Signal. Let this October journey begin with us. Simply send a message and be a member of Alpha Crypto Signal premium.
Feel free to search in our channel and verify the signals yourself.


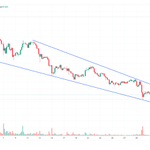
$AXS is coiling in a 4h falling wedge near the lower boundary.
Price is ~0.853. Watching for a bullish reversal. Long only on a confirmed break above the upper trendline. That opens a stronger recovery.
A 4h close under the lower boundary kills it.

ethereum:0x455e53cbb86018ac2b8092fdcd39d8444affc3f6 is trading inside a 4h horizontal channel and approaching the lower boundary.
Price is ~0.090. Long near the bottom of the range while that support holds. Target is the upper boundary.
A 4h close under the lower line kills it.

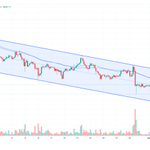
$ZEN is consolidating near the mid-level of a 4h descending channel.
Price is ~5.37. The first sign of strength is a reclaim of that mid-line. That opens a push toward the upper channel boundary. A break of the upper line is the confirmation.
A 4h close under the lower channel line kills it.

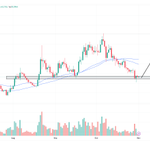
$ADA is holding the horizontal support after the correction.
Price is ~0.194. Buyers stepped in and it’s stabilizing. Long while that zone holds. Next is a push toward the 50 EMA and SMA near $0.219–$0.229.
A daily close under the support kills it.

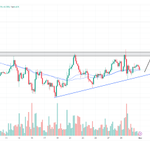
$ZEC is coiling in a 4h ascending triangle.
Price is ~1,252, holding the rising trendline while pressing the horizontal resistance near $1,360–$1,400. Long on a clean break and hold above that zone. That opens another leg higher.
A 4h close under the rising support kills it.

$TAO is holding above the mid-term horizontal support after the correction.
Price is ~237. Structure stays bullish while that zone holds. A retest of it is the long. Next resistance sits near the EMAs around $260–$274.
A daily close under the support kills it.


$AERO is back on the mid-term horizontal support after the sharp correction.
Price is ~0.618. That zone is the key level for bulls. Long while it holds. A bounce here can target the higher resistance near the recent highs.
A daily close under the support kills it.

Thoughts on #BTC:
$BTC experienced a sharp breakdown directly following the incident of Binance exploit, invalidating the primary $80,000–$79,500 horizontal support shelf and turning it into strong overhead resistance.
$BTC is now testing the key demand zone around $76,500–$77,200. Holding this level is critical to prevent a deeper slide toward the lower $72K range. Until $BTC reclaims $80,000+, market conditions are expected to remain choppy and defensive.

$EIGEN broke the 2h broadening wedge and is holding above the resistance line.
Price is ~0.208 and already in the low-volume zone. If the breakout holds, the next push can run fast toward $0.225.
A 2h close back under $0.190 kills it.

$ADA is coiling in a 4h falling wedge near the lower boundary.
Price is ~0.201 after the extended drop. A bounce toward the upper line is the first step. Long only on a confirmed break above the wedge resistance.
A 4h close under the lower boundary kills it.

$TAO is coiling near the apex of a daily symmetrical triangle.
Price is ~248, testing the rising support while still under the EMA cluster. A daily break above the upper trendline and a reclaim of $264 opens $320, then $360+.
A daily close under the rising support kills it.

$ZEC is building a 4h rounding bottom and holding the curved support.
Price is ~1,247, bouncing off the EMA cluster. Higher lows keep the structure intact. Next is a retest of the $1,380–$1,400 neckline. A high-volume break and flip opens $1,520+.
A 4h close under the EMA floor kills it.

$ZETA broke the falling wedge and finished the retest.
Price is ~0.0396, now testing the horizontal support zone. Long while that floor holds. Continuation stays on the table.
A 4h close under the zone kills it.

$ORDI is coiling in a 4h descending triangle, stuck under the upper trendline and the 55 EMA near $3.70.
Price is ~3.65, testing the $3.50–$3.55 demand base. The EMAs are still capping it. Long only on a flip of the trendline and 55 EMA into support.
A 4h close under $3.50 kills it.

$PENGU is retesting the breakout of its 4h symmetrical triangle.
Price is ~0.00773, right on the resistance-turned-support line. Long only on a 4h close that holds above it. That keeps the continuation open.
A close back inside the triangle kills it.

$OP is holding the lower horizontal support after the extended decline.
Price is ~0.112 and consolidating on the zone. Interesting for spot accumulation if it holds. Long on a clear bounce. Next resistance is the 50/200 EMAs near $0.117–$0.118.
A 4h close under the support kills it.

initia:native is building a multi-month rounding bottom on the daily.
Price is ~0.166 and well above the full EMA cluster (55 at ~0.111, 100/200 near $0.095–$0.096). It is approaching the macro neckline at $0.20–$0.21. A clean daily break and flip of that level opens a fast push toward $0.30+.
A daily close under the rising base kills it.

$INJ broke the 4h symmetrical triangle and is retesting the broken trendline as support.
Price is ~8.10. Long while the retest holds. Next target is the recent highs near $9.40.
A 4h close back under the trendline turns it into a fakeout.

$ZEC is forming a cup and handle on the 4h and has cleared the weekly VWAP near $1,272.
Price is ~1,312 and entering a low-volume zone. The long opens on a 4h close above the handle high around $1,360. Next target is $1,480–$1,520.
A close back under the VWAP and $1,240 kills it.
