

cooking unrealised profits since 2021 my telegram for cooperation: @abclogic
join my tg →
Joined May 2025
- Tweets5.7K
- Following66
- Followers2.1K
- Likes7K




$FET at $0.15 is testing something more important than support.
People's patience.
The same crowd that dreamed of buying the dip at $3 suddenly wants nothing to do with it.
I get it. The chart looks terrible.
But two major cycles have already shown what happens
when serious money rotates into AI.
If this base holds and buyers return, $7.50 is my ambitious third-cycle target.
The funny thing about conviction is
that everyone claims to have it until the price actually gets interesting.

$STRK at $0.042 is either a ridiculous opportunity
or the ultimate value trap.
From $2+ to practically zero.
Years of selling, and now the weekly chart is completely flat.
But imagine this thing actually waking up.
$1 would already be insane.
$20?
That's the absolute fantasy scenario.
I'm watching for a real reversal before getting too excited.
Because sometimes the ugliest charts produce the craziest comebacks.

$TEL is down 97% from its all-time high.
And somehow, I can't stop looking at this chart. 💀
Five years of pain.
Almost zero hype.
Trading at $0.0013.
The old ATH sits at $0.0648.
My wild bull-case target? $0.08.
That's a potential 60x if everything goes right.
Could it stay dead forever? Absolutely.
But everyone dreams of catching a 50x
until they see what the chart looks like before one.

$INJ has a history of making people look stupid for ignoring it.
2021: $25.
2024: $50.
Next cycle: $100? 👀
Trading around $7, with the weekly chart sitting near a long-term accumulation zone.
That's a potential 14x if the wildest bull case plays out.
Everyone wants the next 10x. Almost nobody wants to buy before

$TIA at $0.47 is the kind of chart that makes you question your own sanity.
Once a $21 coin. Now practically forgotten.
And somehow, I'm looking at those same highs again. 💀
$9.24 → $11.89 → $21.12.
That's a potential 40x+ comeback if this critical zone holds and a real reversal begins.
Sounds delusional?
Maybe. But the funniest thing about crypto is how quickly "impossible" turns into "obvious."

$QNT spent years getting rejected at $150.
Then it broke out, ripped toward $370
and came right back to test the old resistance.
Now that same zone could become the launchpad. 👀
Hold $150–$170, and I'm watching $370 first.
$700 is the crazy bull-case target.
The funny thing about crypto?
The levels everyone wanted to sell can become the exact levels they wish they'd bought.

$WLD has reached the point where even a 5x would barely get it back above $2.
That's how brutal this collapse has been. 💀
But the weekly chart is showing a pretty interesting long-term setup.
$2.08 → $4.15 → $11.94.
A potential 30x from current levels if the wildest scenario plays out.
Call me crazy, but I'm not writing this one off just yet.

$AERO just gave everyone a taste of $1, then sent them straight back to $0.63. 💀
But this is where things get interesting.
The weekly is retesting a key breakout level after months of building a base.
Hold $0.63 and I'm eyeing $1.58 → $2.22.
$3.30 is the dream scenario.
One good bounce here could change the entire picture.

$FET has already pulled off two insane rallies.
2021: $1
2024: $3.50
2027: $7? 👀
Now it's sitting at $0.16, and the entire AI narrative feels like a distant memory.
Imagine telling someone holding $FET today that this thing could make another 40x move.
They'd probably laugh in your face.
And that's exactly what makes round three so interesting.

$INJ spent two years getting absolutely murdered.
Now look at the weekly. Something is finally waking up.
$7 today. $16.5 is the first real test.
Above that, $35 and $53 are back in the conversation.
And the crazy part?
The chart even leaves room for $80+ in a full-blown mania.
Sounds insane, I know.
But the biggest moves usually start when nobody believes they're possible.

$ZEC at $1,300 and people still think the move is over.
I see something completely different.
Higher lows.
Strong support.
A rising channel that hasn't broken yet.
$3,000 sounds insane until you realize how far this thing has already come.
I wouldn't be surprised if the next leg catches everyone off guard.

$FIL at $0.89.
Once traded above $200.
Now almost everyone has forgotten it exists.
And that's exactly what makes this chart interesting.
Years of bleeding.
Price sitting near the bottom.
Almost zero excitement.
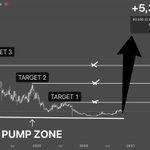
My long-term targets:
$118 → $237 → $430
That's a potential +36,090% on the chart.
Insane? Absolutely.
Guaranteed? Not even close.
But imagine ignoring $FIL at $0.89 and watching it come back to life.

$EVAA is down 96% from its ATH.
And somehow, this is where things get interesting.
Everyone wanted it at $13.
Now it's sitting around $1.38
and nobody wants to touch it.
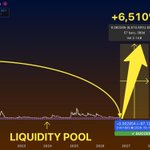
Look at that liquidity zone.
If this is the bottom, the upside could be absolutely ridiculous.
My wild target? $16.
That's a potential +3,668% move.
Sounds insane.
But so did the last bull run before it happened.
I'm watching $EVAA closely.

$AERO TO $3.70?
I THINK THIS CHART DESERVES ATTENTION.
While everyone is chasing coins that have already pumped
$AERO is trading around $0.68.
And the weekly structure is getting interesting.
After a long decline, price has started recovering from its historical support zone.
My targets:
$0.63 - key support
$1.58 - first major upside target
$2.22 - previous high
$3.70 - extended bullish scenario
That's roughly +1,000% in the most optimistic scenario.
The interesting part?
Most people won't pay attention until the price is already significantly higher.
Of course, this setup still needs confirmation
and losing support would weaken the entire thesis.
I'm watching $AERO closely.
Would you buy it at $0.68 or wait until it breaks $1?

$LUNC AT $0.000045.
WHAT IF THIS IS THE BOTTOM?
Think about it.
Down over 92% from its 2022 high.
Years of selling, failed rallies
and people completely giving up.
And yet, $LUNC is still holding near its historical support zone.
That's what makes this chart interesting to me.
My upside scenario targets $0.0013.
A potential +3,404% move from the marked entry.
Sounds ridiculous?
Absolutely.
But crypto has a history of making ridiculous moves when nobody expects them.
I'm not saying $LUNC will definitely get there.
The risk is enormous.
But I'm watching this setup.
Because sometimes the coins everyone has written off are the ones that surprise you most.

$PYTH is down 93% from its all-time high.
And somehow, this is where things get interesting to me.
At $0.075, almost everyone who bought during the hype is underwater.
Sentiment is dead, and the chart looks absolutely brutal.
But look at the weekly timeframe.
Price is approaching a major historical low after nearly three years of selling.
My upside scenario? A move toward $1.27.
That's a potential +2,207%.
Crazy target?
Absolutely.
Guaranteed?
Not even close.
But I've seen enough crypto cycles to know that the charts
nobody wants to touch sometimes become the ones everyone wishes they'd bought.
Would you take the risk on $PYTH here?

$XLM at $0.17 while my chart points toward $2+.
Sounds ridiculous, right?
But here's what interests me.
Every major rally in $XLM's history started when almost nobody cared about it.
2021 gave us a massive run.
2024 brought another explosive move.
And now we're back near the same long-term accumulation zone.
The weekly structure is still holding
and the upper trendline points toward $2.
That's over 3,000% potential upside from here.
Am I saying it's guaranteed? Of course not.
But I think the biggest mistake people make in crypto is waiting for a alt to pump 500% before deciding it's worth buying.
I'm watching $XLM closely.

$SEI at $0.05 is either a massive opportunity or one of the biggest traps in crypto.
And that's exactly why I'm watching it.
The weekly chart shows price sitting near a historical liquidity zone after years of selling pressure.
If this base holds and momentum returns, here's what I'm looking at:
$0.3905 - First major resistance
$0.7346 - Next upside target
$1.1419 - Previous high territory
The full bullish scenario suggests 3,734% potential upside from the marked base.
Crazy numbers, I know.
But remember, a coin being down 95% doesn't automatically make it undervalued.
The real question is whether buyers are finally ready to take control.
Would you risk buying $SEI here?

I'm probably going to sound insane for saying this
but $FET at $0.17 looks more interesting to me than it did at $3.
Look at the weekly chart.
Years of price history, a massive correction
and now we're sitting right in the historical discount zone.
My levels are simple:
$0.98 → $2.18 → $3.46
And if the market really goes crazy, the bigger scenario points toward $5+.
That's a potential 4,546% move from the marked base.
The reversal still needs confirmation
but I'm watching this closely.
The funny part? If $FET ever gets back above $3
people will probably start calling it a bargain again.

Every time $RENDER has been crushed into these lows
the market eventually found a reason to send it flying again.
Now we're sitting around $1.76, with years of price history behind us.
I think the next major expansion could be absolutely insane.
My long-term target is $24, a potential 50x move from the measured cycle low.
Of course, that requires a massive shift in momentum.
But I'm watching this setup closely.
The funny part? If $RENDER ever reaches $20 again
people will suddenly explain why it was so obvious.
Would you hold through the volatility for a move like this?
