

Data Markets and Investing Reporter @CNBC | Previous: @Axios, @CTVNews, @PSBJ, @qz, @TheStreet, @SeekingAlpha | A @durhamalumni | RTs ≠ endorsements
- Tweets6.2K
- Following210
- Followers514
- Likes1.8K


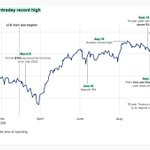


ALT S&P 500 falls sharply in March before recovering to an intraday record of 7,844.52 on Oct. 6, 2026, with key market milestones annotated.

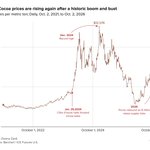
ALT Line chart of daily cocoa futures prices from Oct. 2, 2021, to Oct. 2, 2026. Prices rose from roughly $2,500 per metric ton in 2022 to a record $12,565 in December 2024 after Côte d’Ivoire halted forward cocoa sales in January 2024. Prices later fell sharply before rebounding in 2026 as El Niño raised renewed supply concerns, ending at about $5,610 per metric ton.


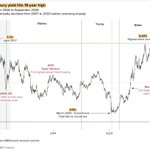
ALT Line chart of the 10-year Treasury yield from 2006 to 2026. The yield fell from above 5% in 2007 to a record low near 0.5% during the Covid shock in 2020 before climbing sharply after the Fed began raising rates in 2022. It reached 5.23% in September 2026, its highest level since June 2007. The chart also marks the financial crisis, the 2013 taper tantrum, recession periods and presidential administrations.
ALT Line chart of the 10-year Treasury yield from 2006 to 2026. The yield fell from above 5% in 2007 to a record low near 0.5% during the Covid shock in 2020 before climbing sharply after the Fed began raising rates in 2022. It reached 5.23% in September 2026, its highest level since June 2007. The chart also marks the financial crisis, the 2013 taper tantrum, recession periods and presidential administrations.

