

50대 아저씨 혼자 중얼거리는 계정. Seoul, Korea.
Seoul, Korea
Joined August 2009
- Tweets40.1K
- Following437
- Followers2K
- Likes12.9K




Pinned Tweet
예전에 써놨던 기술관련 글들은 거의 다 부패해서 사용이 어렵게 되었다. 글더미 속에 같이 있던 금강경 번역만 별도 리포지터리로 독립시켰다. 오래 살거라. drypot.github.io/geum-gang-g…
삼성전자 5.7 만원인가 마지막 매수할 때 졸 불안했다. 삼성 망하고 3만원까지 폭락할 수 있었으니까. 당시에도 외국인은 몇 달 계속 팔았다. 9만원에서 5만원까지 빠졌는데 5만원에서도 6개월 계속 팔았다. 10원이라도 더 빼가야할 것처럼 했다. 이유는 모르겠다. 그게 38만원 됐다가 지금 18만 원.

WTF
$SNDK 2.2x
$SKHY 2.6x
$MU 2.8x
Sandisk can buy back half its market cap in JUST 12 MONTHS.
$COST is 44x for hot dogs and bulk toilet paper.

1
4
162


박규현 retweeted

I've traded through 20+ years of market corrections.
And I've seen the same pattern play out again and again:
1. The market starts correcting.
2. The market stabilizes and moves sideways.
3. A BRUTAL FINAL SELLOFF shakes out the remaining buyers.
That third phase is particularly important.
Here's what I've learned:
1. THE INITIAL CORRECTION
The market starts declining.
Leading stocks begin to break down. Breakouts fail. More and more stocks lose their momentum.
But there's a problem:
There will ALWAYS be stocks moving higher, even during a correction.
And that's exactly why so many traders underestimate the risk.
They keep buying because individual setups still look attractive.
I've learned that a few strong stocks don't necessarily mean the overall market is healthy.
2. THE SIDEWAYS PHASE
After the initial decline, the market stabilizes.
The indexes bounce, move sideways, or attempt to recover.
Selling pressure appears to ease.
Traders become optimistic again.
Maybe the correction is already over?
But this is where things can become particularly dangerous.
The market can spend days or weeks moving sideways before the next wave of selling begins.
And traders who have been buying during this period may suddenly find themselves exposed to another sharp decline.
3. THE BRUTAL FINAL SELLOFF
This is the phase I pay particularly close attention to.
The market breaks lower again.
Selling accelerates.
Sometimes the major indexes decline 3–4% in a single session. Sometimes the weakness continues for two or three days.
Fear increases. Pessimism spreads. Even relatively strong stocks come under pressure.
This is what I call a possible capitulation move.
I've observed this type of behavior around many important market lows.
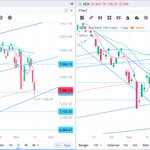
Look at the historical charts I've attached, including April 2025.
Notice how the initial correction and the sideways period were followed by an aggressive final decline.
And notice what happened afterward.
Of course, not every correction follows this pattern. And not every sharp sell-off marks a bottom.
But recognizing this sequence helps me prepare for what could come next.
4. HOW I TRADE A POSSIBLE CAPITULATION
When I see signs of a possible capitulation move, I don't automatically start buying stocks.
My first priority is to reassess my short positions and look to cover them.
Why?
Because after an aggressive decline, the risk of a powerful rebound increases significantly.
But covering shorts is NOT the same as getting bullish.
I can close my shorts and remain entirely in cash.
Then I wait for my market trend model to give me a new signal on the long side.
In the meantime, I'm preparing my watchlist.
I'm looking for growth and momentum stocks showing relative strength and developing constructive setups.
When market conditions improve, I want to be ready.
I don't want to start searching for stocks after the rally is already underway.
5. WHAT I'M WATCHING RIGHT NOW
We could experience a similar acceleration in selling in the coming days.
I don't know whether that will happen.
And I certainly don't know where the exact bottom will be.
But I know what kind of market behavior deserves my attention.
In my latest MARKET UPDATE Premium Weekend Report, I discussed this possibility and what I'm watching as the correction develops.
Throughout the week, I'll continue sharing my market assessments, observations, and the reasoning behind my trading decisions with members.
My goal isn't to predict the next bottom.
It's to help traders understand changing market conditions and make better decisions independently


내 현재 미장 포트는 지수 절반에 나머지 DRAM + NVDA 인데. 지수야 언젠간 양전할 것이니 걱정이 없고. DRAM, NVDA 도 대규모 자사주 소각 종목이기 때문에 조만간 스스로 반등하리라 생각한다. 딥식 사태 때 NVDA 17% 폭락하던 날 부들 거리는 손으로 매수 했었는데 결국 또 꾸역꾸역 올랐다.
4
183


박규현 retweeted

GTA 6 has an Easter Egg referencing Dexter, the serial killer from the TV show.
Players can find his apartment in Vice Beach. You can’t enter it, but the rooftop has items like a knife, syringe, rope and handcuffs, all references to the show.


박규현 retweeted

한국 수출이 사상 처음으로 1조 달러를 넘김
산업통상부 발표 기준, 미국, 독일(2006) 중국(2007)에 이어 세계 4번째. 일본은 아직 달성한 적이 없음
1964년 1억 달러 이후 62년 만에 1만 배
1-10월 반도체 수출 3,968억 달러, 전년 대비 +193.1%, 전체의 42.7%
연합뉴스에 따르면 HBM 점유율 83.0%(2분기), D램 65.6%(상반기)
화장품 수출은 10개월 만에 124억 달러로, 작년 연간 114억 달러를 넘김
산업통상부가 제시한 올해 연간 수출은 1조 1,700억 달러 예상
1-10월 무역흑자 2,949억 달러. 종전 연간 최대였던 2017년 952억 달러의 3배 이상
대단하긴하다👍


박규현 retweeted

BREAKING: US technology stock valuations have hit their lowest level since March 2020 amid the market correction.
The S&P 500 Info Tech Index P/E ratio is now at its lowest since March 20th, 2020, at 16.4x.

