




Pinned Tweet
Here is a summary of the 30 maps of the #30DayMapChallenge - Thanks again everyone as I had a wonderful time and learnt a lot from all of you.

#30DayMapChallenge - Day 30 - remake of days 1 and 29. Python using xarray, pystac and PyGMT where I now clipped the raster.

#30daymapchallenge - day 29 + 23 - raster + process- done completely in Python using pystac to pull the dem (cop-30m), rioxarray to process the data and PyGMT to get the 3D feel. code: tinyurl.com/ye22ufvw

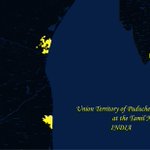
#30DayMapChallenge - day 27 - late - If you drive along the Tamil Nadu coast line from Chennai to the Pondicherry, the boundaries change between Tamil Nadu and the Union Territory of Puducherry.

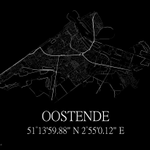
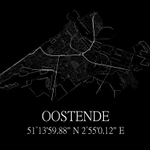
#30DayMapChallenge - day 28 -black - I always wanted to try this out fully in Python with osmnx.


#30DayMapChallenge - late - day 21 - icons - of course #QGIS when it comes to icons 😀


#30DayMapChallenge - day 20 - late - Thanks to @spatialthoughts for their amazing tutorials on which the code of this map was built in Python.


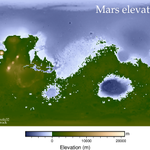
#30DayMapChallenge - late - day 18 - Also using new tool for this and following the amazing PyGMT Python package with some basic styling as this is the first time I mapping something out of the this world 😀.

Ellen Brock retweeted

El día de hoy el #30DayMapChallenge es para probar alguna técnica o herramienta que no hemos usado. Ya antes había intentado hacer un globo terráqueo con un patrón que saqué de internet. Hoy me animé a usar Excel de una forma que no había explorado: para crear patrones.

#30DayMapChallenge - day 17 - new tool - RiverDem in Python (default settings) - A bit experimental and still work in progress. I used the entire DEM file obtained from Copernicus Global Digital Elevation Models and the Python PIL package to finish the image.


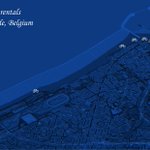
#30DayMapChallenge - day 14 - OSM - Learning the ropes of OSM and #QGIS so I kep it simple.

I always wanted to make something that looked like a poster. I know this is done by many people these type of maps (but not specifically for Oostende - my birthplace) so this was an opportunity to try this out in QGIS.
