
Cloud engineer by day, investor always. Breaking down stocks, earnings & economics. 🇨🇦 Posts are not recommendations or advice. Do your own research.
Canada
Joined July 2022
- Tweets1.8K
- Following641
- Followers245
- Likes2.7K


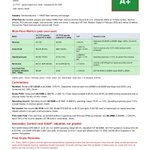




$SNDK Q1 report card vs last year:
Revenue: $11.03B vs $2.31B, +378.0%
Gross margin: 85.0% vs 29.8%
Operating income: $8.78B vs $176M, +4,888.6%
Net income: $8.10B vs $112M, +7,133% (EPS $52.60 vs $0.75)
Free cash flow: $6.31B vs $438M, +1,340.4%
Takeaway: Datacenter revenue went from $269M to $4.8B as NAND pricing soared, while cost of revenue rose just 2%.
This is not investment advice. Do your own research.

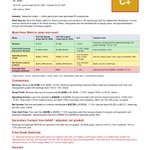
$TWLO Q3 report card vs last year:
Revenue: $1.56B vs $1.30B, +19.9%
Gross margin: 48.8% vs 48.6%
Operating income: $149M vs $41M, +263.0%
Net income: $161M vs $37M, +332.7% (EPS $1.00 vs $0.23)
Free cash flow: $370M vs $248M, +49.3%
Takeaway: Revenue growth accelerated to 20%, and free cash flow was more than double net income.
This is not investment advice. Do your own research.

$ILMN Q3 report card vs last year:
Revenue: $1.13B vs $1.08B, +4.2%
Gross margin: 73.5% vs 67.6%
Operating income: $305M vs $227M, +34.4%
Net income: $220M vs $150M, +46.7% (EPS $1.43 vs $0.98)
Free cash flow: $378M vs $253M, +49.4%
Takeaway: Product costs fell 25%, lifting gross margin nearly 6 points despite the China restrictions.
This is not investment advice. Do your own research.

$SBUX Q4 report card vs last year:
Revenue: $9.14B vs $9.57B, -4.5%
Gross margin: 68.0% vs 67.9%
Operating income: $992M vs $278M, +256.5%
Net income: $677M vs $133M, +408.8% (EPS $0.59 vs $0.12)
Free cash flow: $1.01B vs $926M, +8.9%
Takeaway: North America comparable sales rose 7.9%, China moved to a licensed joint venture, and restructuring and impairment charges fell to $273M from $755M.
This is not investment advice. Do your own research.

$RDDT Q3 report card vs last year:
Revenue: $895M vs $585M, +53.0%
Gross margin: 91.5% vs 91.0%
Operating income: $262M vs $139M, +88.8%
Net income: $283M vs $163M, +74.1% (EPS $1.40 vs $0.80)
Free cash flow: $363M vs $183M, +98.0%
Takeaway: International revenue rose 67%, and the operating margin widened to 29.2% from 23.7%.
This is not investment advice. Do your own research.

$RBLX Q3 report card vs last year:
Revenue: $1.57B vs $1.36B, +15.6%
Gross margin: 79.8% vs 78.2%
Operating loss: -$283M vs -$296M
Net loss: -$227M vs -$256M (EPS -$0.32 vs -$0.37)
Free cash flow: $364M vs $443M, -17.8%
Takeaway: Losses narrowed slightly, but sales and marketing rose 66% and operating cash flow fell 28% as bookings cooled.
This is not investment advice. Do your own research.

$COIN Q3 report card vs last year:
Revenue: $1.22B vs $1.87B, -34.9%
Gross margin: 84.0% vs 86.4%
Operating income: $62M vs $481M, -87.2%
Net income: $719M vs $433M, +66.1% (EPS $2.51 vs $1.50)
Operating cash flow: $406M vs $710M, -42.9%
Takeaway: Trading revenue fell 44% as crypto volatility hit multi-year lows, and a $715M gain on its crypto holdings made up most of net income.
This is not investment advice. Do your own research.

$INTC Q3 report card vs last year:
Revenue: $16.51B vs $13.65B, +20.9%
Gross margin: 43.0% vs 38.2%
Operating income: $2.52B vs $683M, +269.3%
Net income: $3.32B vs $4.06B, -18.3% (EPS $0.60 vs $0.90)
Free cash flow: $1.64B vs $896M, +82.9%
Takeaway: Foundry sales rose 58% and operating expenses barely moved (+0.9%), but last year's profit included a $5.45B gain from the Altera sale.
This is not investment advice. Do your own research.

$MSTR Q3 report card vs last year:
Revenue: $125M vs $129M, -2.5%
Gross margin: 71.5% vs 70.5%
Operating income: $20.91B vs $3.89B, +437%
Net income: $19.12B vs $2.65B, +623% (EPS $44.75 vs $8.42)
Free cash flow: not yet disclosed
Takeaway: Without the $20.9B unrealized bitcoin gain, the software business lost about $2.6M, and preferred dividends tripled to $420M.
This is not investment advice. Do your own research.

$AMZN Q3 report card vs last year:
Revenue: $201.9B vs $180.2B, +12.1%
Gross margin: 53.2% vs 50.8%
Operating income: $28.1B vs $17.4B, +61.2%
Net income: $20.7B vs $21.2B, -2.4% (EPS $1.89 vs $1.95)
Free cash flow: -$33.5B vs +$1.3B
Takeaway: AWS grew 39% to $46.0B, but capex more than doubled to $75.9B, and last year's profit included $9.5B of pre-tax Anthropic gains.
This is not investment advice. Do your own research.