

ETF News, Insights, Data
New York, United States
Joined July 2023
- Tweets298
- Following506
- Followers536
- Likes293


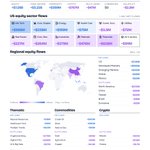
U.S. ETF Weekly Market Recap | Nov. 9-13, 2026
Equity ETFs gathered $60.50B during November 9–13, while fixed income attracted another $2.23B. Cryptocurrency ETFs moved in the opposite direction, losing $1.87B as digital asset prices declined sharply.
Nasdaq-100 ETF $QQQ dominated inflows with $11.30B, followed by $VOO (+$9.69B). Quality-focused $QLTY (+$3.49B) and thematic rotation ETF $THRO (+$3.16B) also attracted significant capital.
But semiconductors told a very different story. $SOXX lost $1.47B despite surging 9.37%, while $SMH shed $1.01B. Memory-focused $DRAM also recorded $468.3M in withdrawals, even as it gained 9.87%.
Technology was another interesting case. The sector gained 3.99% but recorded $844.3M in net outflows, while real estate led sector inflows with $1.27B.
Internationally, Taiwan stood out. Taiwan-focused ETFs gained 9.15% but suffered $780.3M in withdrawals, including $742.5M from $EWT. India (+$500.8M) and Germany (+$430M), meanwhile, attracted fresh capital.
Fixed income investors showed contrasting preferences. Investment-grade corporate bonds gathered $2.34B, while investment-grade government bonds lost $2.78B. Treasury ETFs $GOVT (-$3.84B) and $TLT (-$1.20B) led withdrawals.
Cryptocurrencies had another difficult week. Bitcoin ETFs lost $1.28B, including $1.14B from $IBIT, while Ether products shed $476.8M. Zcash ETF $ZCSH plunged 28.32%, making it the weakest performer in the weekly rankings.
Commodities offered a different picture. Gold ETFs attracted $764.8M despite a 3.93% decline, while crude oil products gathered $266.3M.
On the performance side, South Korean semiconductors led the winners. $KCHP surged 17.59%, followed by $KSMH (+15.46%), AI-focused $CGPT (+13.05%) and semiconductor ETF $FTXL (+12.66%).
Meanwhile, volatility ETFs $VXX (-16.55%) and $VIXY (-14.52%) were among the steepest decliners, alongside losses across XRP and Ether products.


69
US ETF Market Daily Recap | Nov. 11, 2026
Trackinsight data shows that U.S. equity ETFs attracted $2.80B on November 11, while fixed income gathered another $1.85B. Cryptocurrency ETFs, meanwhile, recorded $116.3M in outflows.
Nasdaq-100 ETFs dominated inflows, with $QQQ (+$3.59B) and $QQQM (+$369.5M) attracting nearly $4B combined.
$SPY also gathered $2.09B, while $IVV moved in the opposite direction, recording $343.4M in withdrawals.
Semiconductors told an interesting story. $SMH lost $786M and $SOXX shed $178.7M, even as both rallied 4.80% and 6.07%, respectively.
Technology ETFs gained 3.68% but recorded $695.3M in outflows. Utilities also faced significant withdrawals (-$685.4M), while healthcare attracted $165.6M.
International flows were mixed. Taiwan-focused $EWT lost $453.3M despite surging 5.62%, while Brazil ETFs recorded $148.2M in withdrawals.
In fixed income, investment-grade government bonds attracted $996.6M, followed by corporate bonds (+$725.1M). Municipal bond ETFs, however, lost $338.3M.
Crypto remained under pressure, with Bitcoin ETFs losing $92M and Zcash-focused $ZCSH shedding $14.6M.
Performance was led by AI infrastructure and specialized technology ETFs. $NCLD surged 14.36%, followed by $ARMH (+12.00%), $LYTE (+11.60%) and $LAZR (+9.36%).
On the downside, volatility-linked $VIXY fell 6.60%, making it the only fund in the daily bottom-performers ranking to decline more than 5%.


50
U.S. ETF Daily Market Recap | November 9, 2026
U.S. equity ETFs recorded $3.26B in net outflows on November 9 despite gaining 2.59%. Fixed income attracted $518.1M, while cryptocurrency ETFs lost $542.7M.
Semiconductors saw the biggest divergence. $SOXX lost a staggering $4.44B and $SMH shed $1.10B, even as both rallied 7.45% and 5.00%, respectively.
Meanwhile, Nasdaq-100 ETF $QQQ led inflows with $3.05B, followed by $IVV (+$2.27B), $VOO (+$907.6M) and equal-weight S&P 500 ETF $RSP (+$733.3M).
$SPY recorded the second-largest withdrawals (-$4.29B), while $IWM (-$1.13B) and active equity ETF $CNEQ (-$1.32B) also faced substantial redemptions.
Technology ETFs shed $4.83B despite a 4.13% gain, while financials lost $485.1M and healthcare recorded $310.1M in withdrawals.
International flows were mixed. China-focused ETFs attracted $246M, while Brazil lost $146.5M and Taiwan-focused ETFs shed $66.9M.
In fixed income, high-yield corporate bonds attracted $547.1M, while investment-grade government bond ETFs recorded $1.21B in outflows.
Bitcoin ETFs lost $427.3M, including $397.7M from $IBIT. Ether products shed another $88.9M, extending the pressure on digital asset funds.
Performance was led by nuclear energy, semiconductors and space strategies, with $SMRZ (+10.29%), $SPRX (+9.99%), $PSI (+9.39%) and $XWNG (+9.23%) among the strongest performers.
On the downside, volatility-linked $VIXY plunged 13.35%, followed by Zcash ETF $ZCSH (-12.48%) and tanker shipping ETF $BWET (-9.72%).


70
U.S. ETF Weekly Market Recap | November 2–6, 2026
According to data by Trackinsight, it was a turbulent week for U.S. ETFs. Equity funds attracted $50.46B despite falling 2.70%, while fixed income gathered another $14.05B. Cryptocurrency ETFs, meanwhile, lost $2.01B.
S&P 500 ETFs dominated inflows, with $VOO (+$17.59B), $IVV (+$6.24B) and $SPY (+$2.59B) attracting more than $26B combined.
Nasdaq-100 ETFs also drew significant capital, with $QQQ (+$3.55B) and $QQQM (+$2.28B) gathering $5.83B despite losses across technology stocks.
Here's where things got interesting. Semiconductor ETFs $SMH (+$1.83B) and $SOXX (+$1.19B) attracted billions even as their prices plunged 11.24% and 13.12%, respectively.
Technology ETFs gathered $3.85B despite a 9.06% decline, while industrials and communication services recorded outflows of $1.43B and $1.21B.
International markets also faced pressure. Taiwan-focused $EWT fell 11.41% and lost $404M, while Brazil's $EWZ recorded $382M in withdrawals.
Bitcoin ETFs faced another difficult week, with $IBIT alone losing $1.04B. Across the cryptocurrency category, Bitcoin funds shed $1.56B and Ether funds lost $417M.
Performance told a very different story. Volatility-linked $VXX (+15.71%) and $VIXY (+13.95%) rallied, while gold miners $SGDM (+14.33%) and $GDX (+13.03%) posted double-digit gains. Solar ETF $TAN also surged 12.82%.
On the downside, tanker shipping ETF $BWET plunged 29.69%, while specialized technology funds $CAPA (-24.25%), $CPU (-24.11%) and $DISK (-23.42%) suffered steep losses.


1
47
U.S. ETF Market Recap | November 4, 2026
U.S. equity ETFs attracted $5.13B on November 4, followed by fixed income (+$437.8M) and commodities (+$191.8M). Cryptocurrency ETFs, meanwhile, recorded $216.5M in outflows.
Semiconductor ETFs showed a striking divergence. $SMH led all fund inflows with $1.39B despite declining 2.68%, while $SOXX lost $360.8M and fell 3.01%.
Broad-market ETFs also attracted capital, with $IVV (+$1.08B), $SPY (+$1.03B) and equal-weight $RSP (+$812.9M) among the largest recipients.
On the other side, $QQQ recorded the largest withdrawals (-$2.25B), even as its lower-cost counterpart $QQQM attracted $470M.
Technology led sector inflows (+$1.03B), followed by healthcare (+$280.9M). Communication services experienced the largest withdrawals (-$488M), including $482.9M from $XLC.
Fixed income flows favored investment-grade government bonds (+$1.06B), while corporate investment-grade exposure lost $809.3M, including $1.11B in withdrawals from $LQD.
Gold ETFs attracted $346.6M, including $370M into $GLD, while crude oil products faced outflows of $123.3M.
Performance told a different story. Chinese semiconductors and precious metals miners surged, led by $SMHC (+11.98%), $CRAM (+11.57%) and $SLVP (+10.16%).
Meanwhile, tanker shipping and AI infrastructure ETFs suffered steep declines, with $BWET (-17.83%), $NCLD (-9.11%) and $TCAI (-9.06%) among the weakest performers.


62
Tuttle Capital Launches ETF (DLAY) Targeting Critical AI Supply Chain Bottlenecks
Tuttle Capital Management has launched the Tuttle Capital AI Bottleneck ETF $DLAY, an actively managed fund targeting companies that control critical supply chain bottlenecks supporting the global artificial intelligence infrastructure buildout.
The ETF invests at least 80% of its assets in companies operating across nine AI-related industries, including advanced semiconductors, memory and storage, power grids, nuclear fuel, data center cooling, and connectivity infrastructure.
DLAY identifies companies with concentrated supply, extended backlogs, or limited product substitutability, using a proprietary scoring system to assess their strategic importance.
Holdings are weighted according to market capitalization, exposure to AI infrastructure, and bottleneck characteristics.
The fund can invest globally, including emerging markets, and may use derivatives to manage exposure.

119
U.S. ETF Market Recap | November 3, 2026
Where did ETF investors put their money on Tuesday?
U.S. equity ETFs attracted $13.52B on November 3, while fixed income gathered another $4.03B. Cryptocurrency ETFs, meanwhile, recorded $570.6M in outflows.
S&P 500 ETFs dominated inflows, with $SPY (+$3.92B), $IVV (+$1.71B) and $VOO (+$1.55B) attracting $7.18B combined.
Technology led sector inflows (+$630.2M), supported by demand for $XLK (+$485.5M), while financials attracted $333M. Energy ETFs, however, lost $376.8M.
Bond investors favored Treasury exposure, with $SGOV gathering $1.35B and $TLT adding $834.9M, while $AGG recorded $470.2M in withdrawals.
Regional flows were mixed. Developed-market ETFs attracted $990.7M, while Taiwan-focused funds lost $256.3M, including withdrawals from $EWT.
Gold also faced selling pressure, with $GLD losing $360.8M, while Bitcoin ETF $IBIT recorded $409.8M in outflows despite posting a positive daily return.
Performance told a different story. Bitcoin mining and digital infrastructure ETFs surged, led by $WGMI (+11.00%), $NCLD (+9.73%) and $GCPU (+9.40%).
Blockchain ETFs also rallied, with $BKCH (+8.55%) and $DAPP (+7.44%) among the strongest performers.
On the downside, Chinese memory and AI strategies struggled, with $CRAM (-7.90%), $AICH (-7.35%) and $TGRZ (-7.24%) leading declines.


36
Global X Launches Magnificent Six ETF (SIX) Targeting AI Megacaps
Global X has launched the Global X Magnificent Six ETF (SIX), offering concentrated exposure to six U.S. technology giants: Apple, NVIDIA, Microsoft, Alphabet, Amazon, and Meta.
The actively managed ETF carries a 0.20% expense ratio and seeks to weight holdings by free-float market capitalization, using direct equity investments and derivatives, including swaps. Apple and NVIDIA account for nearly 48% of the portfolio.
According to Global X, the six companies contributed approximately 66% of Bloomberg 500 Index earnings-per-share growth over the 12 months ending September 2026, with combined capital expenditures projected to reach $700 billion in 2026 and $1 trillion in 2027, largely driven by AI infrastructure.
The launch expands Global X's lineup of concentrated technology ETFs, alongside funds targeting LLMs, semiconductors, electronic components, and nuclear technology.
@GlobalXETFs

58
1/2 U.S. ETF Market Overview | Nov 2. 2026
📈 ASSET CLASSES: Equity ETFs led with $7.28B in inflows, followed by fixed income (+$3.22B) and commodities (+$359.2M). Cryptocurrency ETFs moved in the opposite direction, losing $766.6M.
🏢 SECTORS: Technology attracted $566.4M despite declining 2.82%, while consumer staples added $237.6M and energy gathered $159M. Financials suffered the largest withdrawals (-$628.2M), followed by materials (-$475.9M) and industrials (-$278.7M).
🌎 REGIONS: U.S. equity ETFs attracted $7.65B, while developed markets added $589.8M and emerging markets gathered $142.8M. North American exposures recorded $369.9M in withdrawals, while China and Taiwan also experienced modest outflows.
💵 FIXED INCOME: Investment-grade aggregate bond ETFs led with $1.01B in inflows, followed by municipal bonds (+$805.9M), investment-grade corporate bonds (+$533.5M) and high-yield corporate bonds (+$367.7M). Money market government bond ETFs recorded $1.56B in withdrawals.
⚡ THEMES: Cryptocurrency-themed ETFs lost $778.5M, followed by digital infrastructure and connectivity (-$224.5M) and AI and big data (-$126.5M). U.S. defense strategies shed $111.3M, while natural resources attracted $38.4M.
🥈 COMMODITIES: Crude oil ETFs attracted $253.4M despite a 7.19% decline. Silver gathered $183.2M, while gold recorded $150.8M in withdrawals.
₿ CRYPTO: Bitcoin ETFs suffered $617.3M in redemptions, followed by Ether (-$135.4M). Solana products lost $9.7M, while Zcash ETFs shed $3.6M.

1
65
2/2. ETF Leaders & Laggards | Nov 2. 2026
💰 FLOW LEADERS
$SPY dominated the inflow rankings, gathering $5.11B in a single session.
Fellow S&P 500 ETFs $VOO and $IVV followed with $2.56B and $1.47B, respectively.
Together, the three funds attracted approximately $9.14B.
Other notable inflows included:
📈 $SOXX: +$975.1M
📈 $IEF: +$667.8M
📈 $RSP: +$613.6M
📈 $VEA: +$486.1M
📈 $FIGB: +$464.4M
📈 $TLT: +$408.4M
📈 $VTI: +$405.8M
Semiconductor ETF $SOXX stood out, attracting $975.1M despite declining 3.82% during the session.
📉 FLOW LAGGARDS
Dividend-focused $SDY recorded the largest withdrawals, losing $1.63B despite finishing the session higher.
Short-term Treasury ETF $SGOV followed with $1.29B in outflows, while actively managed equity ETF $CNEQ shed $1.09B.
Other significant withdrawals included:
🔻 $IGV: -$387.4M
🔻 $XLF: -$376.8M
🔻 $IVW: -$332.6M
🔻 $BIL: -$269.6M
🔻 $DIA: -$259.6M
🔻 $COPX: -$238.8M
🔻 $IBIT: -$234.8M
Bitcoin ETFs experienced widespread withdrawals, including $IBIT (-$234.8M), $FBTC (-$202.1M) and $ARKB (-$130.1M).
🚀 PERFORMANCE LEADERS
Cannabis ETFs dominated Monday's strongest performers, with four funds recording gains exceeding 5%.
🥇 $MSOS: +7.49%
🥈 $WEED: +6.85%
🥉 $CNBS: +6.15%
📈 $YOLO: +5.50%
AdvisorShares Pure US Cannabis ETF ($MSOS) led the daily performance rankings, followed by Roundhill Cannabis ETF ($WEED).
🔻 PERFORMANCE LAGGARDS
Alternative strategies, cryptocurrencies, photonics and energy ETFs suffered some of the steepest declines.
📉 $QIS: -9.91%
📉 $NRR: -9.09%
📉 $PSIL: -9.01%
📉 $LYTE: -8.35%
📉 $HYPG: -8.18%
📉 $UGA: -8.11%
📉 $NCLD: -7.97%
📉 $BNO: -7.62%
📉 $THYP: -7.48%
📉 $BHYP: -7.43%
Oil ETF $USO also declined 7.34% despite attracting $236.8M in inflows.
🏦 ISSUER FLOWS
Vanguard led issuer inflows with $5.06B, followed by iShares (+$2.43B), State Street (+$2.19B) and Invesco (+$1.16B).
J.P. Morgan Asset Management attracted $441.7M, while Fidelity gathered $346.9M.
On the opposite side, Alger recorded the largest issuer withdrawals (-$1.27B), followed by Global X (-$470M) and Roundhill (-$226.8M).

93


1/2🧵 U.S. ETF Weekly Market Overview | October 26-30, 2026
📈 ASSET CLASSES: Equity ETFs led with $4.18B in inflows, narrowly ahead of fixed income (+$4.14B). Commodities attracted $317.6M, while cryptocurrency ETFs recorded $98.8M in withdrawals.
🏢 SECTORS: Financials topped the rankings with $875.1M in inflows, followed by healthcare (+$786.1M) and energy (+$297.7M). Technology suffered the largest withdrawals (-$417M), alongside a 5.26% decline.
🌎 REGIONS: U.S. equity ETFs attracted $4.32B, followed by Japan (+$69.7M) and developed markets (+$63.5M). North American exposures lost $256.8M, while Brazil recorded $47.1M in withdrawals.
💵 FIXED INCOME: Investment-grade corporate bonds dominated demand, attracting $2.01B. Investment-grade municipal bonds followed with $642.8M, while aggregate bond ETFs added $452.4M. High-yield corporate bonds also attracted $360.3M.
⚡ THEMES: Next-generation internet ETFs attracted $58.8M despite broader technology weakness. Digital infrastructure and connectivity strategies lost $54.5M, while cryptocurrency-themed ETFs shed $102.6M and declined 5.15%.
🥈 COMMODITIES: Silver attracted $167.3M, despite a 4.43% decline, while gold gathered $39.8M. Natural gas added $13.7M, and crude oil ETFs attracted $8.9M.
₿ CRYPTO: Ether ETFs recorded the largest withdrawals (-$108.9M), followed by Solana (-$23M) and Bitcoin (-$14.4M). XRP products bucked the trend with $8.4M in inflows. Solana and Bitcoin ETF exposures declined 5.77% and 5.25%, respectively.

1
90
2/2🧵 U.S. ETF Weekly Market Overview | October 26-30, 2026
💰 FLOW LEADERS
$QQQ dominated the inflow rankings, attracting an impressive $3.94B in a single session.
Investment-grade corporate bond ETF $LQD followed with $1.39B, while financial sector ETF $XLF gathered $878.8M.
Other notable inflows included:
📈 $XLV: +$425.3M
📈 $QQQM: +$420.8M
📈 $IJR: +$392.8M
📈 $VCIT: +$382.5M
📈 $VCSH: +$366.1M
📈 $XBI: +$284.7M
📈 $XLE: +$262.5M
📈 $SOXX: +$212.2M
Together, Nasdaq-100 ETFs $QQQ and $QQQM attracted approximately $4.36B.
📉 FLOW LAGGARDS
$SPY recorded the largest withdrawals, losing $2.00B during the session.
Dividend-focused $CGDV followed with $710.7M in outflows.
Other significant withdrawals included:
🔻 $VOO: -$647.9M
🔻 $IVV: -$569.2M
🔻 $SMH: -$496.6M
🔻 $SPIB: -$346.4M
🔻 $IWM: -$307.4M
🔻 $IGV: -$276.5M
🔻 $RDIV: -$242M
The contrast among major S&P 500 ETFs was notable. $SPY, $VOO and $IVV all experienced substantial withdrawals, while Nasdaq-100 funds attracted billions.
Semiconductor ETFs also recorded opposing flows, with $SOXX attracting $212.2M while $SMH lost $496.6M.
🚀 PERFORMANCE LEADERS
Volatility-linked ETFs stood out as most equity strategies faced selling pressure.
🥇 $VIXY: +10.57%
ProShares VIX Short-Term Futures ETF ($VIXY) topped the daily performance rankings, reflecting a sharp rise in short-term volatility futures exposure.
No other fund in the daily top-performers ranking gained 5% or more.
🔻 PERFORMANCE LAGGARDS
Semiconductor, AI infrastructure and blockchain ETFs dominated the largest declines.
📉 $ARMH: -9.87%
📉 $NCLD: -9.60%
📉 $LYTE: -9.07%
📉 $AIFR: -9.06%
📉 $BKCH: -8.87%
📉 $SPRX: -8.84%
📉 $GCPU: -8.64%
📉 $BTGD: -8.63%
📉 $WGMI: -8.54%
📉 $RKNG: -8.44%
📉 $PSI: -8.30%
📉 $SOXX: -8.23%
Neocloud ETF $NCLD and photonics ETF $LYTE both declined more than 9%, while blockchain and Bitcoin mining strategies also suffered substantial losses.
Notably, $SOXX fell 8.23% despite attracting $212.2M in inflows.
🏦 ISSUER FLOWS
Invesco led issuer inflows with $3.79B, supported by demand for Nasdaq-100 ETFs.
iShares followed with $2.54B, while Vanguard attracted $1.42B.
Schwab gathered $344.5M, followed by J.P. Morgan Asset Management (+$254.7M) and Fidelity (+$254.5M).
Capital Group recorded the largest issuer withdrawals (-$658.3M), followed by VanEck (-$374.7M).

1
80
:
📈 ASSET CLASSES: Equity ETFs led with $6.03B in inflows, followed by fixed income (+$1.61B). Cryptocurrency ETFs attracted $106.4M, while commodities recorded $328.7M in withdrawals.
🏢 SECTORS: Financials led with $559.1M in inflows, followed by materials (+$357.5M) and healthcare (+$110.2M). Technology suffered the largest withdrawals (-$728.4M), while real estate lost $107.3M.
🌎 REGIONS: U.S. equity ETFs attracted $5.05B, followed by developed markets (+$617.8M). Brazil recorded $273.7M in withdrawals, while Taiwan-focused ETFs shed $63.9M.
💵 FIXED INCOME: High-yield corporate bond ETFs attracted $666.9M, followed by investment-grade corporate bonds (+$468.6M) and aggregate bond ETFs (+$389.3M). Investment-grade government bonds recorded $296.4M in outflows.
⚡ THEMES: Cryptocurrency-themed ETFs attracted $89.9M, followed by next-generation internet (+$54.2M) and cybersecurity (+$20.1M). Global defense strategies lost $21.6M, while nuclear energy ETFs shed $16.5M.
🥇 COMMODITIES: Gold ETFs recorded $192.8M in withdrawals, while agricultural commodity products lost $139.1M. Crude oil ETFs bucked the trend with $32.1M in inflows.
₿ CRYPTO: Bitcoin ETFs attracted $182.3M, while Ether products lost $36.7M. Zcash ETFs added $14.8M, while Solana funds shed $9.5M.

1
43
💰 FLOW LEADERS
State Street's SPDR S&P Dividend ETF ($SDY) topped the inflow rankings with $1.60B, signaling substantial demand for dividend-oriented equity exposure.
$SPY followed with $1.35B, while financial sector ETF $XLF attracted $520.9M.
Other major inflows included:
📈 $IWR: +$407.2M
📈 $IVV: +$386.5M
📈 $IWM: +$369.4M
📈 $SMH: +$337.0M
📈 $URTH: +$311.8M
📈 $USHY: +$241.4M
Notably, semiconductor ETF $SMH attracted $337M despite withdrawals from its major competitor.
📉 FLOW LAGGARDS
iShares Semiconductor ETF ($SOXX) recorded the largest withdrawals of the session, losing $1.52B.
Nasdaq-100 ETF $QQQ followed with $464.9M in outflows.
Other notable withdrawals included:
🔻 $DFAT: -$302.9M
🔻 $GLD: -$295.2M
🔻 $IGOV: -$275.0M
🔻 $EWZ: -$270.0M
🔻 $IQMM: -$238.2M
🔻 $ARKK: -$210.5M
The semiconductor divergence was particularly notable. $SOXX lost $1.52B while $SMH gathered $337M. Combined, the two funds recorded approximately $1.18B in net outflows.
🚀 PERFORMANCE LEADERS
Hyperliquid-linked cryptocurrency ETFs dominated the daily performance rankings, with all three leading products gaining more than 15%.
🥇 $THYP: +15.95%
🥈 $BHYP: +15.93%
🥉 $HYPG: +15.11%
The gains stood in contrast to losses across several other cryptocurrency and technology-related strategies.
🔻 PERFORMANCE LAGGARDS
Chinese semiconductors, artificial intelligence and specialized technology ETFs recorded the steepest declines.
📉 $SMHC: -6.86%
📉 $NRR: -6.58%
📉 $AIUP: -6.52%
📉 $AICH: -6.46%
📉 $GXPC: -6.46%
📉 $TGRZ: -6.38%
📉 $CRAM: -5.79%
📉 $CPU: -5.61%
📉 $NCLD: -5.48%
📉 $PHOX: -5.31%
China semiconductor ETF $SMHC led the declines, while NEAR-focused $NRR and AI-managed equity ETF $AIUP also fell more than 6%.
🏦 ISSUER FLOWS
State Street led issuer inflows with $3.38B, supported by strong demand for $SDY, $SPY and $XLF.
iShares followed with $1.46B, while VanEck attracted $493.7M and Vanguard gathered $480.4M.
Dimensional recorded the largest issuer withdrawals (-$465.2M), followed by ProShares (-$223.2M) and ARK Investment (-$142.5M).

1
62
Franklin Templeton Launches Two ETFs Reinvesting Dividends Into Bitcoin (FBEQ, FIBT)
Franklin Templeton has launched two ETFs on Nasdaq combining U.S. equities with Bitcoin through systematic dividend reinvestment.
The Franklin U.S. Equity Bitcoin DRIP Index ETF (FBEQ) and Franklin U.S. Innovation Bitcoin DRIP Index ETF (FIBT) each start with a 95% equity allocation and 5% Bitcoin exposure, directing equity dividends into Bitcoin over time.
Quarterly index reviews follow rules designed to keep Bitcoin a secondary allocation.
FBEQ tracks approximately 500 large U.S. companies through the VettaFi U.S. Large-Cap 500 Bitcoin DRIP Index, charging 0.09%.
FIBT follows the VettaFi U.S. Innovation 100 Bitcoin DRIP Index, covering 100 major Nasdaq-listed nonfinancial companies, with a 0.19% fee.
The launches introduce a hybrid approach to equity and digital asset investing, allowing Bitcoin exposure to build through dividend reinvestment rather than direct investor contributions.
@FranklnTempletn @Vetta_Fi

51
1/2. 🧵U.S. ETF Market Overview | October 28, 2026
📈 ASSET CLASSES: Equity ETFs led with $1.84B in inflows, followed by fixed income (+$1.36B). Commodities attracted $297.2M, while cryptocurrency ETFs added $108.9M.
🏢 SECTORS: Technology topped the rankings with $630.2M in inflows, followed by healthcare (+$532.4M) and communication services (+$171.7M). Energy suffered the largest withdrawals (-$302.9M), followed by financials (-$211M).
🌎 REGIONS: U.S. equity ETFs attracted $985.3M, while developed markets added $519.5M and emerging markets gathered $260.1M. Brazil suffered $605.2M in withdrawals, while Japan attracted $109.9M.
💵 FIXED INCOME: Investment-grade municipal bond ETFs dominated with $669.6M in inflows. Broad aggregate bond ETFs added $344.8M, while investment-grade corporate bonds attracted $194.3M. Investment-grade government bonds lost $378.2M.
⚡ THEMES: Cryptocurrency-themed ETFs attracted $108.9M, followed by next-generation internet (+$75.2M) and cybersecurity (+$63.1M). Biotechnology and genomics gained 5.19%, while global infrastructure ETFs lost $77.7M.
🥇 COMMODITIES: Gold attracted $199.6M, followed by silver (+$72.8M). Crude oil ETFs lost $33.6M despite higher returns for the category.
₿ CRYPTO: Bitcoin ETFs gathered $125.6M, while Ether products lost $60.6M. NEAR ETFs shed $4.9M, while Zcash attracted $2.1M.

1
87
2/2. 🧵ETF Leaders & Laggards | October 28, 2026
💰 FLOW LEADERS
$IVV topped the inflow rankings with $1.36B, followed by inflation-protected Treasury ETF $SCHP (+$899.5M).
Dividend-focused $CGDV attracted $751.8M.
Other major inflows included:
📈 $VOO: +$463.6M
📈 $SPYM: +$440.6M
📈 $VTEB: +$437.4M
📈 $VEA: +$422.5M
📈 $XBI: +$307M
📈 $SOXX: +$260.9M
Notably, $IVV, $VOO and $SPYM all attracted capital despite substantial withdrawals from $SPY.
📉 FLOW LAGGARDS
$SPY suffered the largest withdrawals, losing $2.35B in a single session.
$QQQ followed closely with $2.32B in outflows despite finishing the session higher.
Other notable withdrawals included:
🔻 $EWZ: -$617.1M
🔻 $IEF: -$590.3M
🔻 $IQMM: -$511.4M
🔻 $IWS: -$388.3M
🔻 $XLE: -$284M
Brazil-focused $EWZ stood out, combining $617.1M in withdrawals with a 2.43% decline.
🚀 PERFORMANCE LEADERS
Memory chips and Asian semiconductor ETFs dominated Wednesday's strongest performers.
🥇 $AHBM: +7.93%
🥈 $DISK: +7.84%
🥉 $KMEM: +7.47%
📈 $DRAM: +7.30%
📈 $NRAM: +7.24%
📈 $KCHP: +6.73%
📈 $KSMH: +6.69%
📈 $EMAG: +6.68%
Memory-focused ETFs occupied the top five positions, highlighting a strong session for specialized semiconductor exposure.
Neocloud ETF $NCLD also gained 6.50%, while genomics ETF $ARKG rose 6.33%.
🔻 PERFORMANCE LAGGARDS
Israel-focused ETFs faced the sharpest declines.
📉 $ISRL: -6.22%
Other notable decliners included $EIS (-4.68%), $BRF (-4.12%) and $ISRA (-3.80%), although their losses remained below 5%.
🏦 ISSUER FLOWS
Vanguard led issuer inflows with $2.51B, followed by iShares (+$1.12B), Schwab (+$1.11B) and Capital Group (+$1.04B).
Invesco recorded the largest issuer withdrawals (-$1.99B), followed by State Street (-$1.06B) and ProShares (-$514.9M).

48
1/2. 🧵U.S. ETF Market Overview | October 19–23, 2026
📈 ASSET CLASSES: Equity ETFs led with $19.12B in inflows, followed closely by fixed income (+$15.92B). Cryptocurrency ETFs attracted a modest $49.1M, while commodities suffered $1.71B in withdrawals.
🏢 SECTORS: Technology dominated with $6.84B in inflows, despite declining 0.40%. Energy followed with $377.4M. Utilities suffered the largest withdrawals (-$1.19B), followed by consumer discretionary (-$1.00B) and financials (-$856M).
🌎 REGIONS: U.S. equity ETFs gathered $13.94B, while developed markets added $3.00B. South Korea attracted $582.4M, followed by Japan (+$381.7M). Europe lost $220.5M, while China shed $148.1M.
💵 FIXED INCOME: Investment-grade municipal bonds dominated demand with $5.21B in inflows. Investment-grade government bonds added $3.11B, while aggregate bond ETFs attracted $2.54B. High-yield corporate bonds lost $353.7M.
⚡ THEMES: AI and big data ETFs attracted $640.5M, followed by electrification (+$244.8M). Biotechnology and genomics suffered $1.90B in withdrawals, despite gaining 2.93% over the week. U.S. defense ETFs shed $270.7M.
🥇 COMMODITIES: Gold ETFs lost $1.71B as gold exposure declined 4.19%. Agriculture shed $80.9M, while silver attracted $36.9M despite falling 6.61%.
₿ CRYPTO: Bitcoin ETFs gathered $334.5M, while Ether products lost $297.7M. Zcash attracted $41.1M and gained 6.82%, while Solana ETFs shed $30.2M.

1
65
2/2. 🧵 ETF Leaders & Laggards | October 19–23, 2026
💰 FLOW LEADERS
$VOO topped the weekly inflow rankings with $6.22B, despite declining 0.46%.
Semiconductor ETFs were close behind:
📈 $SOXX: +$5.32B
📈 $SMH: +$2.53B
Together, the two funds attracted an impressive $7.85B, even as both finished the week lower.
Other major inflows included:
📈 $MUB: +$2.30B
📈 $SPY: +$1.88B
📈 $EMXC: +$1.43B
📈 $LQD: +$1.30B
📈 $VTI: +$1.28B
📈 $CNEQ: +$1.21B
📉 FLOW LAGGARDS
$QQQ dominated weekly withdrawals, losing $6.54B.
Small-cap ETF $IWM followed with $2.45B in outflows despite gaining 2.02%.
Other notable withdrawals included:
🔻 $GLD: -$2.26B
🔻 $IVV: -$2.04B
🔻 $ARKG: -$1.92B
🔻 $ARKK: -$1.44B
🔻 $IGV: -$1.06B
🔻 $XLU: -$887.6M
Interestingly, $QQQ lost $6.54B while its Nasdaq-100 counterpart $QQQM attracted $1.12B. Both declined 0.79% over the week.
🚀 PERFORMANCE LEADERS
Chinese robotics and cybersecurity strategies dominated the weekly winners.
🥇 $CROB: +13.22%
🥈 $BUG: +12.48%
🥉 $WCBR: +12.46%
📈 $WCLD: +11.83%
📈 $XA: +11.20%
📈 $IHAK: +10.76%
📈 $HACK: +9.22%
Defiance China Robotics ETF ($CROB) led the rankings, while several cybersecurity and cloud computing ETFs posted double-digit gains.
🔻 PERFORMANCE LAGGARDS
Precious metals miners and natural gas ETFs faced the steepest declines.
📉 $SGDJ: -11.64%
📉 $SIL: -10.33%
📉 $SLVP: -10.13%
📉 $UNG: -10.05%
📉 $SILJ: -9.72%
📉 $GOEX: -9.66%
📉 $GAVA: -9.61%
📉 $GDXJ: -9.53%
Junior gold miners ETF $SGDJ led the losses, while silver miners, natural gas and Avalanche-focused crypto ETFs also struggled.
🏦 ISSUER FLOWS
Vanguard led issuer inflows with $13.88B, followed by iShares (+$10.67B).
VanEck attracted $2.78B, while J.P. Morgan Asset Management added $2.54B and Alger gathered $2.41B.
Invesco recorded the largest issuer withdrawals (-$5.31B), followed by ARK Investment (-$3.39B).

73