Gilberto (@gilbertocrypto1) header
Gilberto (@gilbertocrypto1) profile picture

Crypto supporter and pattern watcher. My tweets are just my opinion and in no way, shape or form financial advice. #DYOR

Multiverse
Joined December 2017
Photo by Gilberto (@gilbertocrypto1)Photo by Gilberto (@gilbertocrypto1)Photo by Gilberto (@gilbertocrypto1)Photo by Gilberto (@gilbertocrypto1)Photo by Gilberto (@gilbertocrypto1)Photo by Gilberto (@gilbertocrypto1)Photo by Gilberto (@gilbertocrypto1)Photo by Gilberto (@gilbertocrypto1)Photo by Gilberto (@gilbertocrypto1)Photo by Gilberto (@gilbertocrypto1)
$BTC monthly
31
26
3
266
45,140
Gilberto retweeted
Many people are predicting an altcoin bull market in the near future, and I am also analyzing and convinced that way. In this market sentiment, many investors have no choice but to flock to altcoins, and in particular, they are focused on investing in altcoin futures trading to make short-term profits. In these situations, cleaning is necessary without fail, and retailers who enter for the purpose of short-term profits are naturally cleaned during this process of delay and small shaking. Anyway, I maintain my view on the altcoin bull market and believe it will move according to the chart below.
Why am I so confident in the alt bull market? As you can see in the chart below, you can see that the altcoin bull market has been delayed. However, despite the period delay, as always, the flow of moving averages exactly matched the past, and the compression caused by the long delay will create a stronger upward driving force than in the past. The moving averages, which will act as a strong trigger for the current price movement, have formed golden crosses, which always show a parabolic pattern. Don't tell me I didn't tell you. I already told you everything.
3
39
229
8,632
#Altcoins I really can't understand how larger accounts are already talking about a possible top. Yes, we're no longer early, but most Altcoins haven't moved much yet, but will IMO. 90% of the gains are made in the last 10% of the bull market, so relax. Higher.
52
190
6
1,167
39,940
Ethereum community is capitulating with one of the best charts out there. LOL.
135
263
20
2,384
204,082
Gilberto retweeted
I believe that a huge revolution will come soon. LUNC already has a technical base that can process payments made on the X platform faster and cheaper than any other coin, and even considering the significant increase in the number of In addition, USTC's dollar-based algorithm as well as the algorithmic system of stablecoins around the world are linked to LUNC, making it ideal for maintaining the security of the distributed ledger to be implemented on the Here's the solution. USTC re-peg is a problem that can be solved simply and easily with an agreement between Binance, which will provide liquidity, and X, who will use it. In the crypto market, there is probably no coin that currently exists that would provide a more ideal solution than #LUNC and #USTC .
61
248
13
804
53,436
Gilberto retweeted
It is very obvious that after kicking out small retailers and clearing the high leverage of the futures market, it will rise supported by strong momentum. Additionally, this phenomenon is especially evident right before a trend reversal in the market. Last year, after a long period of convergence, LUNC made a large-scale downward adjustment to shake off retailers and lighten the order book, leading to a rapid rise. LUNC is facing the same situation as last time. What is very positive is that LUNC is at the end of this convergence, and based on trends in the altcoin market cap and market indicators, this rise is expected to show a bigger and stronger movement than the last rise. #LUNC $LUNC
28
102
6
463
16,673
$BTC 4H "Painful Chop" played out to a T now let's bring home the W
15
71
3
393
57,743
#Altcoins Everyone talks about #Altseason, but many still don't know what that means. We have been in a crypto bull market for 2 years now, but this is different. When every dip gets immediately compensated and scooped up like this, it means that these wicks are merely there to grab some liquidity. Many of the good altcoins don't really correct. It means that most coins will gain like +2 to +5% on green days whereas others, like XRP recently, or now ONDO, FTM, HBAR and many more are in their vertical pump phase. They will pump several 100% before correcting. But this also means that staying calm is a virtue here. You might feel the urge to shift from a coin that has not moved to one of the movers. However, if you have done your research, and the project is solid, their time will come. While many will be chasing the pumps, those who stay patient, accumulate and enjoy the gains when it's their time, will outperform the market.
28
92
4
544
30,255
Another #altseason trigger? When #Bitcoin touches this line...
124
484
25
2,880
300,879
Gilberto retweeted
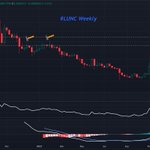
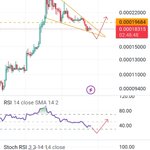
Are you feeling mentally shaken and losing faith? This is because you are only looking at the coins that are being pumped among the numerous coins in the market and do not know the rotation mechanism of funds according to the circulation structure. As you can see in the LUNC chart below, the low point is gradually rising, and LUNC is targeting to break the red bar, which is a strong resistance area within the upward trend. In addition, it has already settled in the MA200 and is following the trend well. The intensity of the rise in the current section is expected to be proportional to the amount of energy compression. There doesn't seem to be any problem. #LUNC
34
73
2
399
16,466
Gilberto retweeted
Bitcoin holdings on exchanges are at an all-time low. This reduces supply and increases buying pressure. Many market participants say that Bitcoin has risen a lot, but in fact, indicators are sending signs that the main game in the market begins now. #btc #Altcoinseason2024 #LUNC
12
58
1
359
13,317
Gilberto retweeted
LUNC is following the flow well and there doesn't seem to be any problems. Looks good, very good indeed. 🚀 #LUNC
LUNC is on the verge of entering an unprecedentedly strong parabolic pattern. As you can see in the chart below, the red bar indicated is the High Volume Area, which is also the price range where a very large volume of transactions took place. The relative difference with the volume of surrounding price ranges is more important than the absolute volume of a specific price range suggested by the volume profile. The basic mechanism of the volume peak, whether in the upward or downward direction, is when the slope of the trading volume around the price is 0. Therefore, it is important to strongly break through the red bar shown in the chart below. Breaking through this point can result in very strong price action and can also be seen as the starting point of new price formation. LUNC has made several attempts to break through this section, and it is highly likely that the movement was actually a volume test, not a failure to break through. In any case, LUNC is ahead of a major turning point and will increase its volatility to its maximum to accomplish this task. I maintain my existing point of view and believe that there is no better chart than this to get to the zero gravity zone. #LUNC
21
91
5
457
26,978
Just the beginning.
6,218
9,974
2,099
62,592
5,851,232
$BTC weekly keep your hands and feet inside the ride at all times
$BTC weekly election and FOMC volatility might bring a retest of the broadening wedge, but I believe the FVG is likely to go unfilled new ATHs are coming after this week's uncertainty dissipates
3
9
1
75
5,973
$BTC 1H bull flag update breakout, retest, and regained full bullish MA alignment the setup is there for a spectacular monthly close, ideally $76K+, let's see if bulls can deliver
$BTC 1H forming a bull flag with a measured move to nearly $80K
9
8
86
3,861
#BTC ETF inflows coming in massive right on time heading into the Election It just seems only a matter of a time before ATHs break
#BTC historically in election years begins to quiet down in July and doesn't get too exciting until late October/November:
10
18
227
15,549
ALTCOINS. Now when I do share a fractal it is very important to understand the underlying strength or weakness in structure to know if the probability is high or low for it to continue and where we are in the cycle. They work until they don't and majority fractals I always see (mostly on the stock market) comes from different periods in the cycles and not the same, in this case the analog used is from a similar point in the cycle as myself and some others have repeatedly pointed out by now. The % basis will likely also not be the same, here I have shrunk it to fit our current % flow of the cycle. Now I know I will get questions on my top time predictions which is sooner than the fractal anticipates IF it were to continue. Altho structure and cycle is the same I do believe its following BTC closer this cycle than its previous ones. And I will go into more detail some other time. For now- this looks good either way.
29
48
3
374
56,844
Gilberto retweeted
Volume plays an important role in the price discovery process. Analyzing volume patterns can provide valuable insight into the strength and sustainability of price trends. Measures the significance of volume spikes or drops by comparing current volume to historical averages. Past unusual trading volume can be a sign of significant price movement. This is a very important indicator for insight into price turning points and price prediction, so it is highly reliable. The chart below is the chart at the time of the LUNA collapse in May 2022, and as you can see, the oscillators are clearly distinguished according to the price crash section that occurred during the collapse. This allows us to understand the extent of the amount of inventory created as the price falls, and this section can be both a very strong resistance point and a support position. Therefore, as you can see in the chart below, LUNC has three strong resistance zones. First, the 0.00026 ~0.00029 zone is a section where a lot of trading volume is concentrated, and if this section is recaptured, it can be expected that the acceleration section can be entered with strong energy. Second, the 0.0026~0.0027 zone is the section where the volume oscillator is the strongest, and is considered a waiting section for a very large dumping occurrence, and a deep adjustment seems inevitable. Third, the 0.032 to 0.036 range is considered the last C of the A, B, and C waves that will be created during the rise, and is adjacent to the large price gap. In general, there are no cases of the price gap being closed and rising further after waves A, B, and C. I see this section as the final destination of the cycle and believe there will be a long convergence period with a very deep adjustment. This is calculated along with the trend movement on the Votex indicator and is the sum of 14 periods of +VM=current price (absolute value)-VM=past price (absolute value)+VM14=+VM, which is called the True Range. That is, =VI14=+VM14/TR14-VI14=-VM14/TR14 Let’s remember 0.00026~0.00029 /0.0026~0.0027/0.032~0.036 I am strongly confident that LUNC will reach the 0.03 zone in this cycle. #LUNC
64
148
20
596
143,343
$SPX monthly breakout of a 95-year trendline with the September close
6
5
1
43
2,607
Gilberto retweeted
I will sell 70% of my LUNC in stages at the first point (0.0022~0.0027), which is judged to be the high point of impulse number A wave. This is because from 0.00025, which is a huge hand change zone, the high point of Impulse A wave is exactly 10 times the profit zone, is a zone where there is strong selling pressure in terms of investment psychology, and is exactly the same as Fibonacci 1.618. The idea that it will rise further beyond this section is very foolish. It does not fit the market price logic and has no possibility. Also, basically, the rise of the adjustment after the end of wave A is basically -70 to -80% from the highest point, and the downward adjustment after a sharp rise is a typical pattern that applies to almost all coins. I will sell 70% of my total LUNC, take a wait-and-see approach, and buy again at the end of the adjustment.
32
55
1
214
11,731