
Data visualization designer @nzzvisuals. Likes things that are beautiful and practical. https://nitter.cf/t.co/lDcip0kSSn
Bern-Brugg-Zürich
Joined August 2009
- Tweets701
- Following312
- Followers331
- Likes276


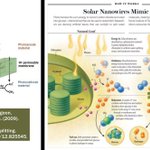



First visualization for online and print with @gian_marti and Eugen Fleckenstein about bird migration. I especially like the story of the "Pfeilstorch" (German has words for everything it seems). nzz.ch/panorama/vogelzug-die…

Who would like to be my new boss ;)

Spannende Stelle zu vergeben: @NZZ sucht Verstärkung im Ressort Visuals - neue/r LeiterIn Grafik. Präge mit, wie wir digital und visuell stark weiter vorwärts machen. karriere.nzz.ch/offene-stell…
2
Jonas Oesch retweeted

Microsoft open sources SandDance, the beloved data visualization tool from @MSFTResearch.
Read here: msft.it/6019TRih9 #JavaScript #analytics


Jonas Oesch retweeted

offer_final_final2_reallyfinal.doc

Boris Johnson will present a "final offer" alternative Brexit deal to the EU on Wednesday
politi.co/2mUu8m4
Jonas Oesch retweeted

Vega 5.7.0 has been released! 📊 Includes support for more statistical routines, dot plot layout, chart subtitles, multi-line text, and more: github.com/vega/vega/release…

Jonas Oesch retweeted
How did I not know this!?
(You can let iOS fill passwords from Lastpass and now login forms on news sites I subscribe to are no longer too tedious to fill)


Beim #Klimagipfel in New York sicherten 65 Staaten verstärkte Bemühungen zu, bis 2050 klimaneutral zu werden. Die NZZ hat berechnet, welchen Anteil sie am weltweiten Treibhausgasausstoss stellen. @mjKolly @jonasoesch nzz.ch/wissenschaft/klimawan…
Jonas Oesch retweeted
Wir freuen uns sehr, dass das Grafikteam von @nzzvisuals nun wieder komplett ist: Herzlich willkommen, @jonasoesch!
👨💻💡📈📊🖌📲
The simple mechanics that lead to segregation… and the equally simple mechanics that counter it. Explained with polygons. And simulations that you can play around with. It's perfect. I don't know how this could have been done any better.
buff.ly/2loLMKp

2
Thougts about scientifc illustration by Jen Christiansen who is a long-time art director at the Scientific American. The article is worth the read for the examples alone.
buff.ly/2qclbT6


TabNine offers code autocompletion based on 2 million files from Github. It's simply text generation for source code. One of these: how could it have taken so long to get this idea moments. The deep learning version is almost frighteningly accurate.
buff.ly/2JLENH9

Jonas Oesch retweeted

As fires rage in Siberia, Canada, Greenland and Alaska: we've published our 🔥wildfire explainer🔥
How do they start? How do we fight/prevent them? What's the deal in🇨🇭? ..And climate change?
Insights and data in 🇩🇪: nzz.ch/wissenschaft/erklaert…
in 🇺🇸🇬🇧: medium.com/@wiederkehr.ac/a-…
I especially like this flowmap from a @NatGeo story on bird migration. It looks like these illustrations of the circulatory system from the 80s. Some inspiration for @ilyabo maybe? The whole article is worth experiencing (that's the proper word, I guess). buff.ly/2FAfZ29

Why simply color your barcharts when you can stick movie posters inside them? Thanks to Tiffany France for putting fun in a simple chart like this. buff.ly/2UMRhWp (sadly it only works in Chrome)

2
A wonderful (and old) example of integrating text and images to explain a complex subject. Here it's geometric relationships. buff.ly/2UQxOkE

5
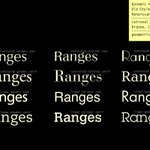
«Type classifications are useful, but the common ones are not». I totally agree with @kupfers and her proposal is a big step forward. Her proposed combinatorial categories like "linear geometric serif" lead you in a pretty specific territory already. buff.ly/2FqGZml

1
Jonas Oesch retweeted

Jonas Oesch (@jonasoesch) of the IIT (@fhnw_iit) is giving a lecture on "What does usability bring" as a part of our computer science (CS) seminar series. Here he's deconstructing 'sitability' :)

Jonas Oesch retweeted

I wrote a #makingof of OECD's Going Digital Toolkit, how we created a scalable chart system with just the right amount of curation. Made at @IXT with @chrizs @wereHamster @herrstucki @FloredC @wiederkehr @solangevogt blog.interactivethings.com/h… #Datavisualization #chartsystem

How populist are you? Take the quiz from the @guardian (buff.ly/2TtSBde). I feel quite at ease close to Macron. The summary of the reader's positions is interesting too. There is also a Swiss version from @TA_Interaktiv buff.ly/2TJaR5o
