

Fragmented Equilibrium
Joined March 2021
- Tweets296
- Following54
- Followers872
- Likes749


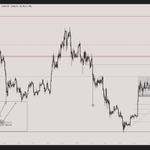

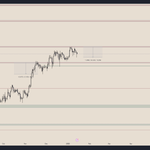


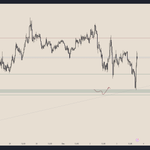


Uzun zaman sonra eski tradinview hesabıma bakayım dedim,Ne diyeceğimi bilmiyorum fiyat daha oluşmadan athını 1 yıl önceden çizmişiz 😐


110
Eth 1D
with its recent rise, eth has broken the eq zone on the higher timeframe. the w imbalance (red box) and the dashed line (3649) above could act as resistance points. it’s wise to be more cautious when price approaches these levels.
on the short term, if we see a strong sell-off, the eq zone, dashed line (2626), and green box could serve as support. if price drops to these areas, a quick recovery is necessary. if not, the situation could remain frustrating. the diagonal coming from 1400, where the institutional zone and imbalances intersect, might provide support.
if you believe we are in a trend during this process, you can look for the entry strategy i shared in the bottom left on altcoins. identify those that have finished accumulation and broken out—set your alerts. when price reaches those points, depending on the situation, you can enter trades or make scaled entries.

77
gm gm..
been inactive on the crypto side for a while due to military service, moving house, and some personal matters. it was a pretty intense and tiring period for me, but i'm slowly getting back in front of the screen..
starting today, i'll be sharing my charts and small tips with you again. as i've said before, you can see the charts i share not as signals but more as educational content to help you improve yourself.
Btc 3d
btc just broke out of a range it’s been in for 230 days with a strong breakout candle. with a good weekly close, there’s currently no sign of weakness on the higher timeframe. on the short term, if we see a strong sell candle, the green box and the last fvg left could act as support. during this time, imbalances on lower timeframes might work more effectively.
also, since the price is in an exploration phase right now, the diagonals i've drawn could indicate the next resistance levels. you can also try to find these using fibonacci extensions yourself.

1
56
$Sui 1d
Look at the reactions to the levels I drew almost 3 months ago. The price was around 2 dollars then too. Let's see how the last stop above will work if it can come :)


2
77


$ETH
Long time no see...Although I think the market will continue upward, the dashed red line may create a bearish wave in the short term. If this scenario materializes, the green box and green dashed lines at the bottom could be the bottom of the new bullish wave.


$ETH
Nothing much has changed, we continue in the same range.
The points I care about are still working effectively.
We need to break the red boxes for positivity.


$Btc.D
Not bad :)

Btc.D
After almost 2 years,It made the point contact where I was waiting for it.Let's watch what happens next :)


2
105
Btc.D
After almost 2 years,It made the point contact where I was waiting for it.Let's watch what happens next :)
$ETH
Nothing much has changed, we continue in the same range.
The points I care about are still working effectively.
We need to break the red boxes for positivity.
$ETH
I told you about Magic's power, you could have traded there. I did not take a long position because there was no confirmation from the green box.
.....
I changed the range a little bit, if the movement I mentioned occurs, I will take a short position in the short term.🤚


$BTC 6H
I left below the range that looks good to my eyes.
Bullish as long as we don't lose the red line.
If we break the red line with volume, we can go to the points I marked below.
Especially the ultimate target of this projection is the green box. ..


1
82
