

Independent research and media for investors & traders. Nothing here is investment advice. Access our research at https://nitter.cf/t.co/qwC64RrJ1l.
Joined March 2012
- Tweets632
- Following46
- Followers1K
- Likes836





Pinned Tweet
Get access to our research, analysis, and signals, all in one platform—free for 7 days.
Our coverage extends across more than 140 assets, in crypto, stocks, indices, and commodities. Whatever you trade, we're already in.
Unlike other firms, we combine both technical analysis and quantitative algorithms to bring an unparalleled level of confidence in positions we take.
All of our analysts are actively managing or working at a hedge fund. We don't publish theory, but what institutional desks are actually doing.
Create your free account by clicking the link in our bio, or heading to: macroinsight.com.

Oil bounces only modestly after US strike on Iran's Qeshm Island, after a 7.6% fall
Brent regained only a small part of Monday's diplomacy-driven drop, as traders weigh a limited strike against talks that have not been called off.

ALT Oil bounces only modestly after US strike on Iran's Qeshm Island, after a 7.6% fall
Full story, with live prices for the markets it moves: macroinsight.com/news/712a1d…

Oil falls 3% to $110 as Iran talks stay alive and the US midterms near
A draft plan to reopen Hormuz is circulating, but Trump's pledge of no new strikes on Iran runs out after Tuesday's vote, leaving crude caught between a deal and a wider war.

ALT Oil falls 3% to $110 as Iran talks stay alive and the US midterms near
Full story, with live prices for the markets it moves: macroinsight.com/news/35a8e2…

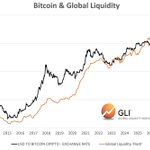
Pay attention: liquidity is telling us where Bitcoin and gold are headed, here's what we see.
Global Liquidity leads risk assets by about THREE MONTHS.
The $2.5 trillion Q1 expansion drove a 13% MSCI World rebound in Q2.
The May liquidity peak has left Q3 gains at just 2.7%.
Fed liquidity drives Bitcoin.
It fell from roughly $80,000 in mid-May to $60,000 as Fed liquidity stalled, recovered to around $85,000, and is still weak.
PBoC liquidity drives gold.
It dropped to $4,000 in Q2, climbed to $4,700 in August, and has since settled near $4,300 as Chinese injections slowed over the past two to three weeks.
This is key: Fed conditions continue to weaken through the quarter.

CC @crossbordercap
Join for free for 7 days⬇️ macroinsight.com

The era of easy broad liquidity is coming to an end, prepare for what might come next.
Global liquidity sits near $195 trillion, but momentum has faded, with 3-month annualized growth down to 1.8%.
To put this into perspective: the shadow monetary base has stalled near $110 trillion, down from a February peak above $112 trillion.
Here's the mechanism.
Chinese injections, a softer dollar, firm bonds, and low volatility keep the stock high, while weak Fed growth and QT in Japan and Europe stop it from expanding.
This is key: rising U.S. yields look like a growth re-pricing, not a loss of confidence.
Term premia are stable to lower, and policy is yield volatility control rather than yield curve control.
Faster nominal growth argues for 10-year yields closer to 4% than 3%.
Sum it all up and this is a speculation regime, not a return to easy broad liquidity.
🤖 Made with AI

Pay attention: Friday's CPI print could decide the Fed's next move, here's what we see.
Economists expect headline CPI to rise 0.4% in August after just 0.1% in July, holding the annual rate at 3.4%.
Core is seen up 0.2% month on month, with the yearly rate easing to 2.4% from 2.5%.
Here's the nuance.
The headline bounce is mainly gasoline and energy, so the gap versus core should WIDEN.
This is key: core is the number that decides whether the Fed holds or hikes next week.
Officials have signaled 0.2% keeps a pause alive, while 0.3% or more reopens a hike.
In-line prints should leave policy odds intact.
A cooler mix would cut hike odds and boost Treasuries and gold.
A hot surprise would firm up September hike pricing and pressure growth stocks.

Bitcoin's MVRV bands are pointing to accumulation, prepare for what might come next.
MVRV Statistical Bands wrap bitcoin:native's cost basis in standard-deviation levels, turning one number into a full map.
Dark red at +2σ marks historical tops.
Purple is fair value.
Dark blue at -1σ is where the next cycle's fuel has usually loaded.
Here's where price sits now.
It pressed the upper red band into the 2024-2025 highs, then spent most of 2026 between the mean and the lower half of the grid, far from both the euphoric top and the dark-blue washout near $16k.
To put this into perspective: realized price, the MVRV equals 1 line, sits near $53k and looks like the structural low this cycle can launch from if the unwind stays orderly.
The read: a black-swan forced-seller event could still tag the -1σ band in the $40k's, but that's the tail risk, not what the bands are showing today.


Pay attention: crude oil just hit a major inflection point, here's what we see.
Crude is reaching a very significant inflection point, and there are multiple opportunities nearby, both for LONGS and SHORTS.
The macro higher time frame picture remains bullish.
Longs are the preferred direction, but at key inflection points, it's worth watching both sides.
Here's the short case.
If crude struggles to break through 93 with multiple failed breakout attempts, a short toward 85 would be a great risk to reward trade.
This is key: if price never attempts the breakout and instead retraces to 85, that's the chance to catch the prevailing trend, with eyes on the big 100 level where escalation risk grows.

Pay attention: Ethereum keeps outperforming Bitcoin, here's what we see.
ethereum:native has been the leader of the majors in the recent rotation higher, continuing to show strength over BTC.
This is key: if crypto sees a dip in the coming weeks, the 2,200 level holds significant liquidity, which should support price.
Any absorption there is a great long signal.
The backdrop supports it.
Crypto markets are heating up, and Saylor's selling pressure is being continually ignored.
Sum it all up and Ethereum stands out as a great long idea into the big supply level at $3,000, where we can expect sellers to step in and suppress price.

The warning signs copper is showing us right now...
Here's the read.
Three things stand out.
One: copper is battling its previous all-time high with clear ranging price action on the higher time frames.
Two: the macro is still bullish, but signs of weakness are emerging after the recent flush.
Three: sellers are clearly in control on the lower and medium time frames.
In other words, this is a range, not a breakout.
This is key: the play is a rotational short on any move higher, aiming for the range lows.
Metals also tend to drift sideways with slight drawdowns in September, which favors range trades over trend-following.


The Nasdaq is setting up for a dip before a bigger move, prepare for what might come next.
After last week's close, the Nasdaq showed local weakness, failing to reclaim key support.
And September is working against it.
To put this into perspective: September is the single worst performing month for US indices in history.
That seasonal drag may be exactly what fills the long idea lower.
Here's where it turns.
October and November tend to be very positive months, and that's where this idea should thrive, with follow-through toward the previous all-time high.
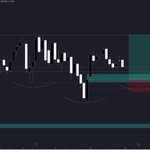
This is key: the higher time frame structure stays constructive, with a potential Head and Shoulders in the making as a base to spring higher.
