

Writing about fund investing for Mutual Fund Observer since 2012.
Washington, USA
Joined July 2017
- Tweets770
- Following266
- Followers239
- Likes8K




10 aug 26 ... $4.2B is largest daily TLT inflow going back to 2002 ... more than 50% above previous largest inflow ... followed by 6 days of inflows for a total of $6.1B ... also largest ever in weekly period, by far ... and on the 8th trading day, 19 aug 26, treasury announces it will "significantly increase government bond purchases under its buyback program"

2
29
Highest Daily TLT Inflow Ever
$4.2B
10.4% of AUM.
This past Monday, 10 August 2026.
$4.9B this week through yesterday.
Previously, highest inflow was $2.7B on 25 June 2024.
TLT launched late July 2002.

1
49
Created new page called Demographics, which provides an aerial view … an Our World of Funds perspective.
mfopremium.com/demographics
mfopremium.com/2026/07/27/fu…
Here’s a chart depicting MFO Premium’s Asset Universe …

35
MFO Premium Mid-Year Webinar 2026 - Bull Market Approaches 4-Year Mark
mfopremium.com/2026/08/08/20…
This coming Tuesday, 11 August, we will be conducting our mid-year webinar to review funds and the site. If you can make it, please join us.
Two sessions are scheduled.
Register for the first session (11 a.m. Pacific / 2 p.m. Eastern): us02web.zoom.us/meeting/regi…
And/or register for the second session (2 p.m. Pacific / 5 p.m. Eastern): us02web.zoom.us/meeting/regi…
The latest cycle, coined The Great Normalization, began January 2022 with a bear market that lasted 9 months. The decline appeared to be in response to COVID-related inflation, a series of quick rate hikes by the Fed, and the Russian invasion of Ukraine. Ironically, despite the negative sentiment, the economy did not enter an official recession.
The bull market that followed, which in retrospect began October 2022, is now 46 months old, approaching the 4-year mark. Since then, through last Friday, the S&P 500 has advanced 125%, or 72% above its previous high.
Bonds, on the other hand, especially long bonds, have retreated. So far, this decade has been the worst for long-bonds in 100 years. TLT is off “just” 4% YTD, but that follows annual returns of -8% in 2024, -31% in 2022 (worst year ever), and -5% in 2021.

1
77
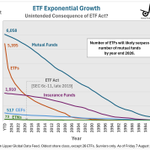
Chart below is an update of one in MFO article "You Too Can Start an ETF," published in January 2025.
At this year’s Morningstar Investment Conference, Bryan Armour discussed the industry wide rotation at a session called The ETF Takeover. He was kind enough to share the session’s definitive chart deck.
Will update each week until the overtake occurs …
As of 7 August 2026:
Mutual Funds vs ETFs: 6,058 vs 5,395.
Almost there, like 100 ETFs per week lately.
Kind of a joke … CorgiFunds, main culprit, mostly mindless levered products, hoping to attract quick AUM.
Then Leverage Shares by Themes. More of same. Example: SPCH – Leverage Shares 2X Long SPCX Daily ETF.
Then Definance. Same. I believe these issued as “white label” via Tidal. Which I’m starting to find akin to the pop-up corner used car or camper or boat salesman. Here today, gone tomorrow. Yep, you have the car (ETF), but does the salesperson (advisor) have any agency? Have any interest in car owner (shareholder)? Need to dig further.
mfopremium.com/2026/07/29/et…
mutualfundobserver.com/2025/…
charlesbalcony.com/mfop_pres…

50
Created Sixty Years page, which presents US stock and bond market risk and return data since January 1960. So, it actually represents 66 or “60-plus” years. This page uses US aggregate bond index [USBOND, like AGG], whereas the Hundred Years page uses long government US bond index [LGOVBND, like TLT].
mfopremium.com/sixty/

30
Created One Hundred Years page, which compiles US stock and bond market risk and return data since January 1926 in single place.
The data in this page have formed the basis of several articles and posts for MFO and MFOP on long-term performance and cycles.
mfopremium.com/hundred/

23
Plot below depicts S&P 500 Resilient Performance across 100-plus years spanning ten market cycles and 16 recessions.
You can find all the cycle plots and tables on the new MFO Premium Cycles page: member.mfopremium.com/cycles.

18
I've been on sabbatical from the site since it was bought by X. Believe today is first time have logged on in 3 years.
Will attempt to re-engage and get back up to speed with the folks I followed, especially the fintech crowd, whom I've missed.
97
Our World – Fund Demographics
member.mfopremium.com/2023/0…
One aspect of our MFO Premium webinar tomorrow Tuesday 11 July, 11 am Pacific.
Along with mid-year review and site update.
Please join us by registering here ...
us02web.zoom.us/meeting/regi…
1
7
209