I've been trying to find all the SPX/QQQ companies in 1999/2000 who got at least 1/3rd of their revs from just one other company and you'll never fucking guess what happened to all four qualifying company I've found so far.
You know what would be an interesting study?
See which days Bluekurtic and I both posted obviously bearish-leaning data and what happened after that.
Sorry bulls, this does not look good. Today, the market weighted S&P 500 $SPY gapped down over 0.5% while equal weight RSP opened higher.
SPY was lower 5 days later in 7 of 9 cases. Let's just get this over with and find a bottom.
It did.
Panic needlessly.
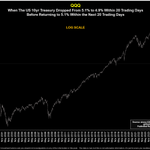
With hours until the open, it's looking like QQQ could have its second -1% gap down in a 3 day period; within a week of a -5% day.
First, here are forward returns and
HOLY
FUCK
THOSE DRAW DOWNS
How about a median 5-day draw down of -9.4%?
Did you hear me?
Then what did I say?
PLAINER ENGLISH:
A bit to explain here, so get comfy.
QQQ still has a couple hours to go until the open, so things could turn around, but as of this second, it looks like QQQ will likely have it's second -1% gap down at the open within 3 days. That 3-day-period will occur within 5 trading days of a -5% day, meaning we've recently had a horrifying day on QQQ and now, barely a week later, we're going to have multiple -1% gaps down.
And how has QQQ reacted in the past? Well, shittily. The median draw down over the NEXT 5 days (so, this would be from the close tonight) is -9.4%!!!
Some things you should know, though:
1) Every prior event happened with extremely elevated VXN (VIX for QQQ)
2) Every prior event happened in a major crash; dot com, GFC, or COVID.
3) n=16; you get to decide how useless that is (hint: very)
4) No matter what you think you're going to do with this, you're going to lose money. You'll see.
Here.
Something bullish.
Halfway through November, the Nasdaq 100 is down 1.6%. Doesn't sound like much, but given November's bullish seasonality, it's the 10th worst start since 1986.
The rest of November for $QQQ was positive in 8 of prior 9 cases. Only exception was 2000 dot com crash.

ALT Bluekurtic Market Insights chart showing the Nasdaq 100’s 10 worst November starts through the 10th trading day since 1986. In 2026, the index fell 1.6%, ranking as the 10th worst. Historically, the Nasdaq 100 rebounded during the remainder of November in 8 of the previous 9 cases (88.9%), with 2000 being the only exception. The chart includes historical price paths, monthly returns, and forward performance statistics.
How far the market would have to drop to get "back to normal"
Pretty cool.