

Home of "Mr Breakouts". Algo Breakout Trading Specialists. Tips and strategies on algorithmic breakout trading. Disclaimer: https://nitter.cf/t.co/G4wi1ZckMa
Joined April 2018
- Tweets3.7K
- Following11
- Followers8.2K
- Likes1.1K






Pinned Tweet
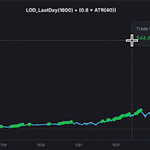
One condition. No indicator. No parameter to optimize. It filtered 80% of bad trades from a NASDAQ breakout strategy.
The condition: is the high of the entry bar above today's open?
That's it. One line of code.
If yes, the market has been trading above today's open. There's an established uptrend for the day. Enter the long breakout.
If no, the market is below today's open when your signal fires. You're not in an uptrend. You're trading noise. Skip.
Before:
- Net profit/drawdown ratio: 5.24
- Drawdown: ~$40,000
- Average trade: $120
After:
- Net profit/drawdown ratio: 7.97
- Drawdown: ~$25,000
- Average trade: $162
Net profit went up while drawdown got cut. That's the signature of a genuine filter. It's removing the right trades, not random ones.
Why does it work? Breakout trading is about momentum. If you're buying a breakout to the upside but the market has been trading below its open all day, there's a contradiction. The price level is breaking out, but the day's direction says otherwise. Those trades are the ones that chop you up.
No parameters means no overfitting. This is pure trading logic. You could test it on any long breakout strategy, on any market, in minutes.
The power isn't in complexity. It's in asking the right question.
What's the simplest filter you've ever used?

Breakout Trading Academy retweeted
I never imagined this would happen.
I started by hacking breakouts in my bedroom.
Then I was featured next to legends like Linda Raschke and Robert Pardo.
Taught my formula to a friend.
We launched Better Trader Academy.
Now we’ve got clients in 64 countries.
> One hedge fund.
> One global revolution.
> All built on the same breakout system I created from scratch.
And it all started with one decision:
Sharing what I’ve learned and know about trading!

Breakout Trading Academy retweeted
A strategy can look great in a backtest and still fail every prop firm check.
Here are the four tests that expose it:
1. Market vs Strategy
- Independent edge score: 76/100 on one gold model.
2. Edge Test
- Compared against 1,000 similar variants: 67/100.
3 Robustness
- Shift entry/exit by 1–3 bars: 80/100.
4. Outliers
- Remove the top 5% of trades.
- Those trades made up 137% of the total profit.
- What’s left after you remove them: negative.
Most strategies die on check 4.
You can have a rising equity curve, a solid robustness score, and still be one or two lucky trades away from a failed challenge.
Which of these four checks do you actually run before you pay a prop firm fee?

A strategy can look great in a backtest and still fail every prop firm check.
Here are the four tests that expose it:
1. Market vs Strategy
- Independent edge score: 76/100 on one gold model.
2. Edge Test
- Compared against 1,000 similar variants: 67/100.
3 Robustness
- Shift entry/exit by 1–3 bars: 80/100.
4. Outliers
- Remove the top 5% of trades.
- Those trades made up 137% of the total profit.
- What’s left after you remove them: negative.
Most strategies die on check 4.
You can have a rising equity curve, a solid robustness score, and still be one or two lucky trades away from a failed challenge.
Which of these four checks do you actually run before you pay a prop firm fee?
Save this and see the full walkthrough of the four checks with the gold example:
breakouttradingacademy.com/p…

1
198
The Prop Firm Playbook expands on the same process, showing how to run robustness checks, build a micro portfolio, and test the full setup against typical firm limits before you start. See the process here:
go-bta.com/prop-firm-playboo…

152
Breakout Trading Academy retweeted
One indicator.
That is still all I need to build a complete breakout strategy.
ATR does the entry.
ATR does the filter.
ATR does the exit.
Entry
> Open of the bar + 2.5 × ATR(20)
> A hard price. It gets hit, or it doesn’t.
Filter
> Short-term ATR vs long-term ATR
> Short-term below long-term = the market is coiling. Take the breakout.
> Short-term above long-term = already expanding. Sit out.
Exit
> Use a fraction of ATR as the stop distance
> The market decides how much room the trade needs
One measurement across all three decisions:
how much the market is actually moving.
If you only use ATR for the stop, the other two jobs are unused.
What do you currently use ATR for?

Breakout Trading Academy retweeted
I tested 100 filter conditions across thousands of breakout strategies.
One kept winning.
It was the slope of a moving average.
Not a crossover.
Not price above or below the average.
The slope itself.
Rankings:
- Out-of-sample: #1
- Robustness: #1
- Total score: #1
Then I checked other markets.
NASDAQ. Gold. Nikkei. Bitcoin.
Same result.
Why it works: a market can sit above its moving average and still be flat.
The slope waits until the average is actually accelerating.
That’s when breakouts have more conviction.
On crypto breakout strategies it improved net profit, drawdown, average trade, and win rate at the same time.
Most filters trade one thing for another. This one lifted multiple metrics together.
100 conditions. Four markets. One winner.

Breakout Trading Academy retweeted
I ran 16.5 million filter tests on NASDAQ.
One condition beat every other oscillator, trend indicator, volatility filter, and volume condition.
The winner: a simple CCI correction filter.
Exact rule for long entries:
Lowest(CCI(27), 18 bars) < –100
In plain English:
Only take the long breakout if, somewhere in the last 18 bars, CCI(27) dipped below –100.
(The market has already had a real correction.)
Results across 1,000 strategy variations:
- Net profit improved on 69% of strategies
- Average trade improved by 22% on more than half
- Bounce index: 57.8% (turned that many losing variations profitable)
On the base NASDAQ breakout:
- Profit/drawdown ratio: 7.53 → 8.6
- Average trade: $116 → $149
Breakouts taken after a genuine washout have room to run.
Breakouts taken into already-extended strength tend to fade.
This wasn’t tested on one strategy.
It was stress-tested across 1,000 different ones.
I ran 16.5 million filter tests on NASDAQ.
One condition beat every other oscillator, trend indicator, volatility filter, and volume condition.
The winner: a simple CCI correction filter.
Exact rule for long entries:
Lowest(CCI(27), 18 bars) < –100
In plain English:
Only take the long breakout if, somewhere in the last 18 bars, CCI(27) dipped below –100.
(The market has already had a real correction.)
Results across 1,000 strategy variations:
- Net profit improved on 69% of strategies
- Average trade improved by 22% on more than half
- Bounce index: 57.8% (turned that many losing variations profitable)
On the base NASDAQ breakout:
- Profit/drawdown ratio: 7.53 → 8.6
- Average trade: $116 → $149
Breakouts taken after a genuine washout have room to run.
Breakouts taken into already-extended strength tend to fade.
This wasn’t tested on one strategy.
It was stress-tested across 1,000 different ones.

Breakout Trading Academy retweeted
I ran 16.5 million filter tests on NASDAQ.
One condition beat every other oscillator, trend indicator, volatility filter, and volume condition.
The winner: a simple CCI correction filter.
Exact rule for long entries:
Lowest(CCI(27), 18 bars) < –100
In plain English:
Only take the long breakout if, somewhere in the last 18 bars, CCI(27) dipped below –100.
(i.e. the market has already had a real correction)
Results across 1,000 strategy variations:
> Net profit improved on 69% of strategies
> Average trade improved by 22% on more than half
> Bounce index: 57.8% (turned that many losing variations profitable)
On the base NASDAQ breakout:
> Profit/drawdown ratio: 7.53 → 8.6
> Average trade: $116 → $149
Breakouts taken after a genuine washout have room to run.
Breakouts taken into already-extended strength tend to fade.
This wasn’t tested on one strategy.
It was stress-tested across 1,000 different ones.

Breakout Trading Academy retweeted
They told us to avoid low ADX.
Turns out... that's exactly where the real edge hides.
📉 SHORTS → ADX > 30 = confirmation
📈 LONGS → low ADX = real edge
Low ADX signals coiled volatility.
It’s not chop. It's a buildup.
So we built our model breakout strategy using:
• Volatility = open–low difference
• Breakout level = low + (3.3 × volatility)
• Stop entries only
• Entry filter: 8am–3pm
• Exit: when ADX > 40 or after time limit
This flip gave us a consistent edge in markets most traders avoid.
Full breakdown + free resource in the comments

Breakout Trading Academy retweeted
Most traders launch strategies and hope the market cooperates.
This reverses the order.
Check the current regime first.
Then only deploy the strategies that have historically worked in that regime.
Markets are classified by direction (up, sideways, down) and volatility (high, normal, low). That creates nine combinations.
Example: a gold pivot breakout strategy.
Its results by regime:
- High volatility + up: strong
- Normal volatility + up: positive
- Low volatility + up: positive
- Most down and sideways regimes: weaker or negative
In one demonstration the market was classified as a volatile downtrend.
Readiness score: 58/100.
Message: mixed conditions - proceed with caution.
The method is simple:
1. Prepare multiple strategies in advance
2. Map how each performed across the nine regimes
3. Assess the current regime
4. Compare readiness scores
5. Only trade the ones aligned with the current conditions
6. Re-check if the regime shifts
A strategy with a high overall robustness score can still be fragile in the wrong regime.
Matching the regime first improves the odds of staying inside prop firm drawdown limits.

Breakout Trading Academy retweeted
I can find a trading edge on any market in about 60 seconds.
No indicators required.
The method is called market mapping.
Here’s exactly how it works:
> Load 15 years of 60-minute data
> Map every entry hour × exit hour × day of the week
> Color the grid by net profit
> Filter for average trade size and profit/drawdown ratio
> Check the robustness index (does the edge survive shifting entry/exit by 1–3 hours?)
> Confirm it still holds in the last 1–3 years
That’s the whole process.
On E-mini NASDAQ this immediately surfaces strong structural tendencies, especially Mondays and certain overnight holds.
Clean example:
Enter 6am -> Exit 4pm (or longer) every Monday.
The edge survives time shifts and remains valid recently.
These aren’t indicator curves.
They are the market’s own built-in time tendencies.
Once you have the time window, you can trade it standalone or drop a breakout strategy inside it.

Most traders launch strategies and hope the market cooperates.
This reverses the order.
Check the current regime first.
Then only deploy the strategies that have historically worked in that regime.
Markets are classified by direction (up, sideways, down) and volatility (high, normal, low). That creates nine combinations.
Example: a gold pivot breakout strategy.
Its results by regime:
- High volatility + up: strong
- Normal volatility + up: positive
- Low volatility + up: positive
- Most down and sideways regimes: weaker or negative
In one demonstration the market was classified as a volatile downtrend.
Readiness score: 58/100.
Message: mixed conditions - proceed with caution.
The method is simple:
1. Prepare multiple strategies in advance
2. Map how each performed across the nine regimes
3. Assess the current regime
4. Compare readiness scores
5. Only trade the ones aligned with the current conditions
6. Re-check if the regime shifts
A strategy with a high overall robustness score can still be fragile in the wrong regime.
Matching the regime first improves the odds of staying inside prop firm drawdown limits.
Save this and see the full regime-alignment walkthrough with the gold example:
breakouttradingacademy.com/w…

224
Breakout Trading Academy retweeted
You might be closer to running a fund than you think.
Turn your trading skill into a real business:
➝ Model AUM
➝ Estimate fee income
➝ See 5-year growth projections
Our Fund Manager Calculator shows your income potential instantly.
See the comments for the link ↓

Breakout Trading Academy retweeted
I tested ADX across the entire index futures sector.
One calibration kept winning.
ADX period 15.
Threshold 17.5–20.
Not the standard 14 and 25.
Not optimized on one strategy.
The average performance across the sector improved when those values were used.
Two more adjustments that helped:
- Check ADX a few bars back instead of on the current bar.
This avoids entering right at the peak of the initial spike.
- Require both the current bar and a few bars back to be above the threshold.
This filters temporary spikes and keeps you in more established trends.
Most traders use ADX as a simple on/off switch.
These three adjustments made it more consistent across markets.

I tested ADX across the entire index futures sector.
One calibration kept winning.
ADX period 15.
Threshold 17.5–20.
Not the standard 14 and 25.
Not optimized on one strategy.
The average performance across the sector improved when those values were used.
Two more adjustments that helped:
- Check ADX a few bars back instead of on the current bar.
This avoids entering right at the peak of the initial spike.
- Require both the current bar and a few bars back to be above the threshold.
This filters temporary spikes and keeps you in more established trends.
Most traders use ADX as a simple on/off switch.
These three adjustments made it more consistent across markets.
Bookmark this and see the full breakdown of the three ADX tips:
breakouttradingacademy.com/m…
342