

From beats to stocks
Vancouver, British Columbia
Joined November 2016
- Tweets1.1K
- Following472
- Followers266
- Likes4.2K





Poor Pay Rich retweeted

Celebrating my 10th Black Friday with TradingView! To mark the occasion, @tradingview is giving away 2 FREE annual subscriptions — one Ultimate and one Premium — to 2 lucky followers here. A little thank you to the community.
How to enter:
🔁 Retweet this post
📷 Follow me and @tradingview
Winners will be announced next Wednesday. Good luck! 🎁


This will mark my 8th year of Black Friday using Tradingview.
Here are 8 FREE public scripts I highly recommend exploring to refine your workflow, templates, or layouts. They’re listed alphabetically by script name:
1. **ADR% - Average Daily Range %** - By @zerokapital
tradingview.com/v/ss2QgCWi/
Use this to study the historical ADR% of securities and analyze how momentum stocks develop and build their volatility patterns.
2. **ATR% Multiple from 50-MA** - Credits to @DumbleDax
tradingview.com/v/oimVgV7e/
My favorite tool for profit-taking or extension signals in setups. It’s also helpful for index analysis to gauge when to scale back on risk exposure.
3. **EPS & Sales** - By @DumbleDax
tradingview.com/v/WiaFmLGR/
Arguably the best EPS & Sales script available. It integrates earnings, sales, beats, and guidance into your charts via table format or below price template, as seen in my trading ideas and stock update.
4. **Financials on Chart** - By @tradingview
tradingview.com/v/Lbxl9OqZ/
A fantastic on-chart display of up to 9 fundamentals (Qtr/Yr) of your choice from over 100 options, including PEG, Earnings Yield, Price to Free Cash Flow Ratio, and ROIC%. This is great for your long-term investment overview without referencing to another 3rd party website for fundamental data.
5. **Industry Group Strength** - By @amphtrading
tradingview.com/v/5NsvcOVp/
This indicator helps you pinpoint the best-performing stocks within specific industry groups. My default template lists the top 5 RS stocks from the same industry as the stock I’m analyzing. @amphtrading also offers 41+ free scripts, making him one of the most generous contributors to our TradingView community.
6. **Range Tightening Indicator** - By @Ollie_AllCaps
tradingview.com/script/yaIen…
A price-tightening indicator using a lookback period. It’s also useful for identifying the "rate of change" of potential bottoms or tops, as highlighted by Stanley Druckenmiller in his podcast with Nicolai Tangen.
7. **Simple Volume with Pocket Pivots** - By @finallynitin
tradingview.com/v/JkB0iCFp/
The most versatile volume script, in my opinion, offering extensive customization for color coding, dollar volume, RVOL, and more.
8. **Swing Data** - Credits to @DumbleDax
tradingview.com/v/uloAa2EI/
This table consolidates essential data for swing traders in a simple format, providing everything you need to improve trading execution & efficiency.
If you found this post helpful and valuable, consider retweeting🔁to spread the words to support their efforts and encourage future updates and enhancements.
I hope these scripts will prove beneficial on your trading journey.

Poor Pay Rich retweeted

6 Entry Types Every Swing Trader Should Know
Entries are one of the first things traders learn because they decide when you get involved in a trade. A good setup can still fail if the entry is poor, and a simple setup can work beautifully if the timing is right.
In this writeup, here are six practical entry types every swing trader should know, along with when and why they work.
1. PDH Entry
Price moves above the Previous Day’s High. It shows strength continuing from the last session.
2. Strong Start Entry
A stock opens well and shows clear strength and high volumes in the first few minutes. After the initial push, a break of any range formation could be used as an entry . Useful in leading stocks.
3. Pivot Break Entry
Price breaks a level that has been rejected multiple times. This suggests sellers at that level are finally out of the way. A clean breakout candle usually confirms it.
4. Anticipation Entry
Entering slightly before a breakout, usually inside a tight consolidation on a day where price has gone pretty tight, at EOD. The structure should already be strong so the breakout has a higher chance of happening. Gives better risk–reward.


Poor Pay Rich retweeted

Momentum bursts are an inherent tendency in stock trading. They refer to a sudden and significant price movement in a stock, typically over a short period, often ranging from 3 to 5 days.
This price movement is characterized by a sharp increase in price and trading volume, suggesting a solid surge in buying or selling pressure.
$LCID is a recent example of this kind of move.

Poor Pay Rich retweeted

block's entire shareholder letter was dedicated to why we're focused on bitcoin, not crypto. the internet needs decentralized digital cash.
we will do our part to help make it accessible, make it secure, and make it usable every day: s29.q4cdn.com/628966176/file…
Poor Pay Rich retweeted
Three sector produce best Episodic Pivots youtu.be/OWBHp3HfswE?si=a5l2… via @YouTube

Poor Pay Rich retweeted
What makes Episodic Pivots more explosive
youtu.be/PYHEDhybAuY?si=mF4q… via @YouTube

Poor Pay Rich retweeted
Episodic Pivots Opportunity in Earnings Season
youtu.be/7osI-XkF3Uo?si=vWhf… via @YouTube

Poor Pay Rich retweeted

This is the first post in a series I'm going to do on the stocks featured in How I Made $2M In The Stock Market by Nicolas Darvas. I'll cover Lorillard, Diners Club, E.L. Bruce, Universal Controls, Thiokol Chemical, Texas Instruments, Fairchild Camera, and Zenith Radio.
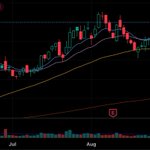
In 1957, Darvas spotted a stock fighting the downward trend of the market. He was alerted to the stock on the large volume spike in October of that year. He bought his first shares after the subsequent breakout. I have notated where he bought and sold on the chart.
For much of its rise, Lorillard (LL) was one of, if not, the most active stock in the market. It began its ascent while the market was making new lows. Massive earnings increases helped it fight the downward pressure of the market.
Studies had began to show a link between cigarette smoking, caner, and heart disease. This health scare resulted in falling sales of cigarettes in the mid 1950s. However, with the introduction of new filtered cigarettes, Lorillard saw sales pick up. They began to heavily market their "safer" cigarettes to the public.
A magazine article compared several different cigarette brands for levels of tar, resin, and nicotine, and declared Lorillard's Kent cigarette brand the clear winner. This publicity led to "health-conscious smokers" choosing Kent cigarettes in droves.
Despite the government's crackdown on "deceptive" marketing tactics and growing concern that no cigarette was safe, sales of Lorillard's cigarettes hit the highest level in the company's 200 year history.
Sales of Kent cigarettes increased more than 500% after the publication of the magazine article. That, along with a new cost-saving industry practice of using stems and other typically not-used material from the tobacco plant in their cigarettes, plus the fact that adding filters to them resulted in using less tobacco per cigarette, sent earnings up hundreds of percent.


Poor Pay Rich retweeted

Notes for all @Qullamaggie 2023 streams to date:
26 January: A change in the market, strength in 🇨🇳 names and a detailed look at Kristjan’s portfolio
tradingresourcehub.substack.…
18 May: A masterclass on EPs 🔥
tradingresourcehub.substack.…
19 May: Timeless market wisdom and lots of charts
tradingresourcehub.substack.…
22 May: A quiet day, though with an important lesson from the charts
tradingresourcehub.substack.…
23 May: Market outlook, AI and quantum, EP charts and breakout conditions
tradingresourcehub.substack.…
1 June: AI and quantum — only just getting started, and Kristjan’s full updated list
tradingresourcehub.substack.…
2 June: The best market since November 2021, but we now need consolidation
tradingresourcehub.substack.…
5 June: Timeless wisdom from the 🐐, preferred action in the indices, updated AI/quantum list, and charts
tradingresourcehub.substack.…
8 June: Another EP class, strength in AI and quantum, and market filter and newsletter recommendations by Kristjan
tradingresourcehub.substack.…
9 June: What bull markets look like and how to trade them
tradingresourcehub.substack.…
=====
BONUS: Qullamaggie interview notes
Chat With Traders, part 1: The mechanics of Kristjan’s breakout strategy: entries, exits, risk management, stock selection, market conditions, and more
tradingresourcehub.substack.…
Chat With Traders, part 2: Kristjan’s psychology, and a step-by-step approach to building conviction
tradingresourcehub.substack.…
The Compounding Lounge: The unavoidable complexity of trading, and the elements you need for success
tradingresourcehub.substack.…
=====
All my Qullamaggie notes:
tradingresourcehub.substack.…
Stream notes only:
tradingresourcehub.substack.…
My full archive:
tradingresourcehub.substack.…

Poor Pay Rich retweeted

William O'Neil didn't just buy stocks right, he sold them right too. Here are 13 essential sell rules William O'Neil followed: 👇🧵
Poor Pay Rich retweeted

Kudos to Poor Pay Rich, our 4th #OptionsTradingSimulation2023 weekly contest winner! With a $500 weekly prize and $10,000 grand prize up for grabs, it’s not too late to join: ms.spr.ly/60109v4Ki
#optionstrading #tradingsimulation #CanadasTopOptionsTrader

ALT Options Trading Simulation Contest


Poor Pay Rich retweeted

Going over my main watchlist this weekend, I started to compile a list of stocks that are either transitioning from Stage 1 to Stage 2 on the weekly timeframe
I also have stocks some people might be tempted to get in but are still in Stage 4
RT if u want me to go over a bunch of them in a free webinar, I will respond later with a link

Poor Pay Rich retweeted
Although we recently lost our founder Bill O’Neil, his wisdom and his influence will live on forever. We’ve collected some short clips of his interviews to share–this one is about his investing routine and the importance of chart reading. “Trust the charts…Charts don’t lie.”
Check out more interviews here ➡️ investors.com/ibd-videos/cat…
#LegacyOfWisdom #FounderRemembered #InfluentialLeadership #BillONeil #InvestingRoutine #ChartReading #TrustTheCharts #ChartsDontLie
Poor Pay Rich retweeted

Stan Weinstein’s Secrets For Profiting in Bull and Bear Markets book explains stock market action into different phases that explains price action within cycles of bottoms, breakouts, uptrends, tops, breakdowns and downtrends.
Stage 1 Stock Market Bottoms
A chart makes a bottom as the market runs out of sellers at lower prices and begins to create a price range and a new sideways base.

Stage 2 Stock Market Uptrends
Uptrends begin as investors begin to accumulate positions at low prices until they run out of sellers at lower prices inside the trading range and create a breakout in prices to higher levels. Uptrends make higher highs and higher lows and rotate between ascending price ranges and new breakouts. In uptrends, dips in price action are bought as they are opportunities to enter at lower prices.

Stage 3 Stock Market Tops
Tops take time to form on a chart as distribution happens at high price levels. Many times a top has a head and shoulders chart pattern as buyers fail to take prices higher multiple times and the top price level is put in. This happens when a chart runs out of new buyers at higher prices and profit taking takes a chart lower.

Stage 4 Stock Market Downtrends
Downtrends begin as fear of loss sets in and investors exit with remaining profits as a chart makes lower highs and lower lows. Trailing stop losses can trigger in cycles taking a chart lower. The best risk/reward ratio for short selling occur early in downtrends or at initial breakdowns to lower prices.
Downtrends happen as stocks are distributed and large positions exited. Rallies are sold into as an opportunity to get out at higher prices.

Understanding what phase of the market cycle a chart or the stock market is in can help understand the path of least resistance to trade with.


Poor Pay Rich retweeted
Moving Average Answer Key:
Moving averages allow traders the ability to quantify trends and act as signals for entries, exits, and trailing stops. They can become support and resistance, and give the trader levels to trade around. Below are examples of the specific moving averages with time frames.
• 5 Day EMA: Measures the short term time frame. This is support in the strongest up trends. This line can only be used in low volatility trends.
• 10 day EMA: “The 10 day exponential moving average (EMA) is my favorite indicator to determine the major trend. I call this ‘red light, green light’ because it is imperative in trading to remain on the correct side of a moving average to give yourself the best probability of success. When you are trading above the 10 day, you have the green light, and you should be thinking buy. Conversely, trading below the average is a red light. The market is in a negative mode, and you should be thinking sell.” – Marty Schwartz
• 20 day EMA: This is the intermediate term moving average. It is generally the last line of support in a volatile up trend.
• 50 day SMA: This is the line that strong leading stocks typically pull back to. This is usually the support level for strong up trends. Use 50-Day Average For Trading Signals
• 100 day SMA: This is the line that provides the support between the 50 day and the 200 day. If it does not hold as support, the 200 day generally is the next stop.
• 200 day SMA: “My metric for everything I look at is the 200-day moving average of closing prices. I've seen too many things go to zero, stocks and commodities. The whole trick in investing is: “How do I keep from losing everything?” If you use the 200-day moving average rule, then you get out. You play defense, and you get out.” - Paul Tudor Jones
Bulls like to buy dips when price is above the 200-day moving average, while bears sell rallies short below it. Bears usually win and sell into rallies below this line as the 200 day becomes resistance, and bulls buy into deep pullbacks to the 200 day when the price is above it. This line is one of the biggest signals in the market telling you which side to be on. Bull above, Bear below. Bad things happen to stocks and markets when this line is lost.

Poor Pay Rich retweeted

And we finalized!
Happy merge all. This is a big moment for the Ethereum ecosystem. Everyone who helped make the merge happen should feel very proud today.
Poor Pay Rich retweeted

Scope the new additions to our Best New Minimal / Deep Tech chart, featuring @MichaliManolaco, @HectorCouto, @PoorPayRich, and more.
btprt.dj/b7a2gj

Poor Pay Rich retweeted
Start your weekend vibes with some of the best new tech house tuneage on Beatport 😎
Featuring:
➖ @TubeandBerger
➖ @Raumakustik
➖ @poorpayrich
➖ @wAFFdj
➖ @djaneyf
➖ @mendoofficial
& more!
beatportal.com/feed-beatport…
Poor Pay Rich retweeted

2021 #Mambo 🇩🇴 1.2 Deep Tech
@poorpayrich 🎚 Get It (@NicZega, @alexsounds20 Rmx) 🔊Unnamed & Unknown
mambo.red ♥ 4 set & track list
#mambo #love #dance #music #art #song #artist #dj #musician #party #musiclife #dancemusic #dancer #housemusic #techhouse #techno