

Books: https://nitter.cf/t.co/VH9p5RkhFQ Newsletter: https://nitter.cf/t.co/nrBv4yVmWa Platforms: https://nitter.cf/t.co/6nk8SdQ6Nw | https://nitter.cf/t.co/6eOukprKLO
Joined July 2019
- Tweets4.6K
- Following0
- Followers13K
- Likes891








Pinned Tweet
Hey guys! I’ve just released a refined, compact edition of one of my newsletter series on the foundations of quantitative trading. It is a theoretical introduction designed for aspiring quants who are beginning to explore the field. The focus is on first principles, method, and the conceptual framework behind quantitative trading.
Link in the comments. I hope you enjoy it.

Long time without seeing this conditions probability formula. I think I should re-edit all the proba series


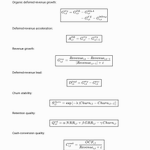
I’m researching subscription businesses where deferred revenue expands because customers are renewing and prepaying. Check organic deferred-revenue growth with stable churn, improving retention, and healthy cash conversion. The setup happens when deferred revenue accelerates before recognized revenue. Go long only when the implied future-revenue gap is large and price begins confirming the improvement.


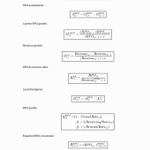
It's pretty common for some SaaS companies to expand their RPO before revenue accelerates. For example, RPO captures contracted future revenue, so persistent RPO growth combined with stable conversion can reveal demand strength that hasn’t yet appeared in the income statement. The setup occurs when current RPO growth, total RPO growth, and deferred revenue all improve while cancellations remain low. Go long only when the implied forward-revenue gap is large and price begins confirming the expected re-rating.


The study separates wallet scoring, model fitting, and evaluation chronologically. However, the authors disclose that the top-decile focus, volatility scaling, and evaluation-window choice were selected after results were available.


It's pretty common for some SaaS companies to expand their RPO before revenue accelerates. For example, RPO captures contracted future revenue, so persistent RPO growth combined with stable conversion can reveal demand strength that hasn’t yet appeared in the income statement. The setup occurs when current RPO growth, total RPO growth, and deferred revenue all improve while cancellations remain low. Go long only when the implied forward-revenue gap is large and price begins confirming the expected re-rating.
Identify industrial or software companies where bookings growth turns higher before reported revenue responds. Then, measure the gap between new bookings, and current revenue growth to estimate how much future sales acceleration is already embedded in contracted demand. The long setup happens when bookings quality is high, cancellations remain low, and the bookings-to-revenue ratio expands while reported growth is still muted.


PBO is 0.85, this indicates that the in-sample winning configuration is very likely to rank poorly out of sample under the study's cross-validation procedure.


Identify industrial or software companies where bookings growth turns higher before reported revenue responds. Then, measure the gap between new bookings, and current revenue growth to estimate how much future sales acceleration is already embedded in contracted demand. The long setup happens when bookings quality is high, cancellations remain low, and the bookings-to-revenue ratio expands while reported growth is still muted.
Focus on stocks where backlog is growing, conversion velocity into sales is speeding up, and reported revenue hasn't caught up. Go long only when the gap between backlog-implied revenue and reported revenue becomes large enough to create a forward growth inflection. Reject cases where backlog rises because deliveries are delayed or customer commitments are weak.


The main experiments assume a stylized local-volatility model with constant equicorrelation and a common market factor. But market autocallables exhibit stochastic volatility, forward-skew dynamics, changing correlations and volatility


Focus on stocks where backlog is growing, conversion velocity into sales is speeding up, and reported revenue hasn't caught up. Go long only when the gap between backlog-implied revenue and reported revenue becomes large enough to create a forward growth inflection. Reject cases where backlog rises because deliveries are delayed or customer commitments are weak.
Measure how dependent the stock is on its largest supplier, then aggregate that concentration of supply-chain stress at the supplier, industry, or geographic level. If supplier dependence rises while input costs, delivery reliability, or financial health deteriorate, this triggers a warning. Use this as a long-avoidance signal and only consider a short position when the company’s own margins, inventory, or price action begin confirming transmission.


