
Gem hunter and trader | Occasional airdrop hunter | Technical analyst
Joined January 2024
- Tweets1.1K
- Following20
- Followers1.1K
- Likes542



Pinned Tweet
If you are new here, join my group.
t.me/shitcapcentral
𖤐 This is where I write more valuable stuff.
✶ On X I mostly repost stuff for you to connect the dots and understand how the whole crypto scamfluencing works.

Market rotation into crypto from indices seems like.
Unusual price action happening now between crypto and stocks.
Crypto is being absorbed and retail panic selling.
5th day of the month, the only thing I can think off here is higher for now, the clues are all over the place.
ETH.D
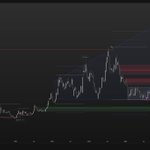
Range fib extension perfectly hit. Range confirmed, LTF wyckoff + bojan.
1h demand test after MS now.
tradingview.com/x/8agV6Qdb/
@Wyckoff_Insider thank you.

BTC x ETH
BTC holding old demand created in august. ETH did not have one which is good, created a new recently.
This is confluence for bullish move now as we have still valid bullish monthly (now also LTF) SSMT between them.
Waiting for bojan lows.
Higher.
@Wyckoff_Insider

USDT.D x USDC.D SSMT
BTC and ETH SSMT, also EURUSD was acting weird today, going up while crypto was dropping - means this was controlled selling, likely a bear trap.
Waiting for bojan highs.


$PYPL is approaching very good flip zone, after that I expect basically only up mode.
First target 98-100$


2 coins with history, one in the making.
I wont name them now, because I know they wont push it to the algorithm if I do.
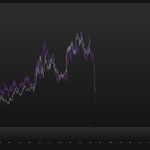
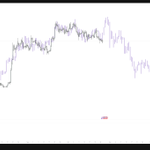
Purple one is a moon as a different name
Regular chart you can see what it is.


HTF weekly DUAL SSMT between USDT.D and USDC.D
Another +1 for bullish confluence.
tradingview.com/x/npzctz77/

T = CVE events, news about cyberattacks.
T+7 FOMC = bullish into FOMC
T+45 loading...
@Wyckoff_Insider 👁️

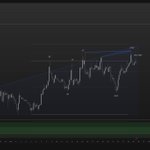
I am still macro bearish on #GBPUSD and #EURUSD
Confluence for the bearish continuation - finished wyckoff + bearish 3 tap + bearish SSMT
bearish monthly SSMT.
tradingview.com/x/1yMs7kJJ/


Long and strong for now. bitcoin:native
One more high (LL/LH, I do not care), then lower.
tradingview.com/x/xg7y3fRi/


This is what we are utilizing too.
Great material to study.

LIQUIDITY V5
Liquidity is one of the most important concepts in trading.
Liquidity is what allows the market to move.
Without liquidity, you can't fill large positions efficiently. The bigger the position you want to build, the more liquidity you need on the other side of your order.
This is why liquidity matters so much.
When you trade enough size, the volume of the instrument you're trading becomes extremely important. You can't expect to market order a large position into a low-volume coin without causing significant slippage or moving the market against yourself.
Large participants need liquidity.
They need people willing to take the other side of their orders.
This is where the concept becomes interesting.
A large player doesn't simply decide to buy a massive position and click market buy.
There needs to be enough opposing liquidity for those orders to be filled.
This is why the market constantly creates, attracts and consumes liquidity.
Stops sitting above highs.
Stops sitting below lows.
Breakout traders entering positions.
Traders closing positions.
Limit orders sitting at important levels.
Market orders triggered by those levels.
All of this creates liquidity.
When you understand this, you stop looking at a high or low as simply a line on your chart.
Where is the liquidity?
Who is likely trapped here?
Who is likely to enter if this level breaks?
Who is forced to exit if this level breaks?
How much liquidity is available?
And most importantly
What does price need to do to access it?
Liquidity is not simply "where the stops are."
It's the available opposing orderflow that allows positions to be entered and exited.
This is why liquidity and structure should always be studied together.
You can see equal highs sitting above price, but that doesn't automatically mean price must take them.
You need to understand the structure, the location, the expected orderflow and the path price has created toward that liquidity.
One of the most important things to understand is the difference between a low-resistance liquidity run and a hard-resistance liquidity run.
A low-resistance liquidity run is when price moves toward a target while continuously mitigating or consuming the opposing liquidity along the way.
Price is essentially creating a good return to zone while moving toward its objective.
This creates a low-resistance roadmap.
And when price finally wants to move through that area, there is very little standing in its way.
This is why these moves can be extremely fast.
You can see price run through an area with almost no pullback, because the market has already done the work beforehand.
The liquidity has been created.
The opposing zones have been mitigated.
The path has been prepared.
Then the expansion happens.
In a hard-resistance run, price is still moving toward the target, but there is significantly more opposing orderflow along the way.
You can see multiple legs.
Reaccumulation.
Redistribution.
Ranges.
Liquidity sweeps.
Pullbacks.
More liquidity being created.
Price is still moving toward the objective, but the roadmap is much harder.
Expected orderflow tells you what you expect the market to do next.
Liquidity gives you the potential destination.
Put them together and you have a much clearer view.
The important thing is understanding whether the expected sequence is still developing.
The goal isn't to predict exactly which liquidity pool gets taken next.
The goal is to understand the conditions surrounding it.
Where is the liquidity?
How was it created?
How much resistance exists between price and the target?
What structure is controlling the move?
What is the expected orderflow?
What happens if the liquidity is taken?
What happens if it isn't?
Once you start asking these questions, your charts become much clearer.

