

- Tweets276
- Following343
- Followers87
- Likes76






ALT Niño-3.4 weekly anomaly 2025/26 vs 2015/16 (NOAA OISST), now +3.4°C; map of SE Asia palm and West Africa cocoa risk regions; historical analogues -10% palm, -7% cocoa.


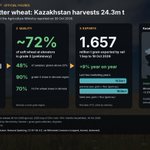
ALT Infographic: Kazakhstan 2026 grain harvest, per the Agriculture Ministry on 30 Oct 2026. Three steps. Harvest: 24.3 million tonnes, versus 27.0 in 2025 (Interfax-Kazakhstan), down 10%, still one of the 3 biggest crops in 15 years. Quality: about 72% of soft wheat at elevators is grade 3; 48% of samples have gluten above 28%; in Akmola region 90% grade 3 and 70% Hi-Pro. Exports: 1.657 million tonnes of grain by rail from 1 Sep to 19 Oct 2026, up 9%; 15.5 and 16.0 million tonnes in the last two marketing years. Locator map highlights Akmola. Illustrative background photo.

ALT Data board: Indonesia Trade Ministry Nov 2026 export reference prices vs Oct. Cocoa HR $6,057.87 to $5,613.60/t (−7.33%), HPE $5,686 to $5,242 (−7.81%). CPO HR $1,042.15 to $978.90/t (−6.07%), export duty BK $178 to $124/t (−30.34%). Official HR/HPE benchmarks for export levies, not farmgate or futures. Source: Kemendag 30 Oct 2026 and 1 Oct 2026 baseline.

ALT Infographic on palm oil traceability in East Kalimantan, Indonesia, based on a Rainforest Action Network investigation published 28 Oct 2026 (allegations). Flow diagram: crude palm oil from KAS Group mills (no zero-deforestation policy), FAP Agri mills and First Resources mills goes to First Resources' PT CAK terminal on the Mahakam River, where RAN says it is commingled, then by barge to Balikpapan Bay refineries for export. Bars: natural forest cleared Jan 2021 to May 2026 in a sample of 11 concessions, over 9,800 ha in total: KAS Group 8,796 ha, First Resources 514 ha, FAP Agri 472 ha. Also: 217,165 ha of Fangiono-linked concessions in Mahakam Ulu and Kutai Barat (64%), about US$1.2bn in credit 2021 to Sep 2026. First Resources and FAP Agri deny the allegations; KAS Group did not respond. Sources: RAN, Mongabay.

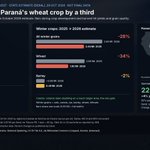
ALT Weather-impact graphic: excess rain cuts Paraná's (Brazil) winter crop. Deral state estimate, 29 Oct 2026, vs 2025 harvest: wheat 2.88 to 1.90 million tonnes (-34%), area -12%, yield 44 vs 54 sacks per hectare, rain-damaged grain limits milling supply; 88% of wheat harvested. All winter grains 3.93 to 2.84 Mt (-28%); barley about 0.50 to 0.49 Mt (-2%); canola volume seen doubling. Map highlights Paraná in southern Brazil. Summer contrast: soy 2026/27 at 22.75 Mt (+4%), 5.74 million ha, 62% planted, 88% in good condition. Source: Deral/Seab-PR via Agência Estadual de Notícias do Paraná. Illustrative wheat field photo, CC BY-SA 4.0.

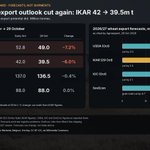
ALT Data board: Russia's 2026/27 export outlook. IKAR estimates, early October vs 29 October 2026: grain export potential 52.8 to 49.0 million tonnes (-7.2%), wheat export potential 42.0 to 39.5 (-6.0%), grain harvest 137.0 to 136.5 (-0.4%), wheat harvest 88.0 unchanged. Farm ministry keeps 140m t. Bars compare 2026/27 wheat export forecasts: USDA (Oct) 40.0, cut by 3.0; IKAR 39.5, cut by 2.5; IGC (Oct) 39.4, cut by 2.1; SovEcon 36.7 (grain total cut by 4.7). Source: Agroexpert, 29 Oct 2026, quoting IKAR. Illustrative grain harvest photo, CC BY 4.0.

ALT Infographic comparing EUDR Operator API documentation environments checked 29 Oct 2026. Left: production docs show API V3; getDdsByIdentifiers still retrieves full DDS content; Last-Modified 15 Oct 2026. Right: acceptance docs show API V4; getDds/getSdByIdentifiers return UI-only detail (NotFoundException); new referenceNumberInfo and EudrUserMessage; Last-Modified 28 Oct 2026. Caveat: documentation state only; official V4 production release date unverified; no authenticated endpoint test. Source: European Commission EUDR Information System Operator API Reference. Research by @silvermanCrypt0.

ALT Infographic: Vietnam's Dak Lak province and IDH signed an MoU on 29 Oct 2026 for a 2026-2030 programme targeting about 75,000 ha of sustainable, climate-resilient, EUDR-ready coffee, roughly 35% of the province's 217,000+ ha of coffee. Map of Vietnam highlights Dak Lak. Bars compare total coffee area 217,000+ ha, provincial goal 150,000 ha, 2021-25 programme 91,500+ ha, new target 75,000 ha and about 28,000 ha certified in 2025. Coffee exports are about $900M a year. Source: Viet Nam News. Illustrative coffee tree photo, CC BY-SA 4.0.

ALT Infographic: IICA study by Bryant Christie Inc., 27 Oct 2026, on the EU's proposed Omnibus X pesticide residue limits. About $44.2bn a year of Americas agri-food exports (2022-24 average) are exposed: South America $29.7bn, North America $10.8bn, Central America $4.81bn, Caribbean $427m. Map and bar chart of value at risk: Brazil $15.4bn, US $7.68bn, Argentina $4.62bn, Peru $2.84bn, Canada $2.0bn, Colombia $1.97bn, Chile $1.83bn, Costa Rica $1.63bn, Ecuador $1.26bn. Central America sends 28.1% of assessed farm exports to the EU. 63 of 151 substances examined could be affected. Value at risk is exposure, not projected losses. Research by @silvermanCrypt0.

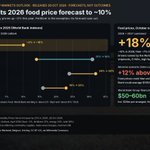
ALT Infographic: World Bank Commodity Markets Outlook released 28 Oct 2026 versus its April 2026 outlook, 2026 price forecasts as % change vs 2025. Food commodities: about 2% in April, about 10% now. Fertilizers: 31% in April, 14% now. Energy: 24% to 32%. All commodities: 16% to 23%. Food prices are seen rising about 7% more in 2027, 18% combined. In an adverse scenario food prices could be 12% above baseline, exceeding 2022 levels. World Bank Group has $50-60bn available, incl. $25bn pre-arranged. Research by @silvermanCrypt0.

ALT Infographic: India's soybean imports in marketing year 2025/26 (Oct-Sep) hit a record 1.1 Mt, up from about 2,000 t in 2024/25, per SOPA data reported by Reuters on 28 Oct 2026. Soymeal exports halved to 1 Mt. India allows only non-GM soybean imports. Map highlights Niger (largest declared origin, over 430,000 t, traders' estimate), Nigeria, Togo, Benin and India. Origin check: customs suspect Nigerian beans declared as Niger for duty-free access; 45% tariff if origin not proven; about 1,500 t held at JNPT on 9 Oct. Research by @silvermanCrypt0.

ALT Infographic: Serasa Experian risk simulation, 27 Oct 2026. Brazil soy 2026/27 on the same 49.9 Mha area: 181.2 Mt in a neutral year vs 163.6 Mt under a strong El Niño, minus 17.6 Mt or 9.7%. Yield 3,622 vs 3,282 kg/ha. Bars by state: Mato Grosso -9.7 Mt, Goias -4.0, Minas Gerais -1.5, Rio Grande do Sul +5.5. Value exposed about R$33 bn, sizing only. Not a crop forecast. Research by @silvermanCrypt0.

ALT Infographic over a dimmed illustrative photo of a wooden boat loaded with wood: 'UN starts talks on a protocol against environmental crime'. Header: UNTOC COP13, Vienna, resolution CTOC/COP/2026/L.4/Rev.1, adopted Oct 23, 2026. Big number: 4 negotiating sessions, each up to 10 days, with a draft protocol to the Conference 'if possible' at COP14; COPs meet every two years, so COP14 is about 2028 (our inference). World map with Vienna marked and EU-27 shaded for context, as the EUDR already requires legal, deforestation-free timber. Scope tiles: wild fauna and flora including timber and timber products; illegal mining and trafficking in minerals and precious metals; illicit trafficking in waste. Timeline: Oct 2026 decision, 4 sessions, COP14 draft if possible, later adoption and ratification. Not yet a treaty. Research by @silvermanCrypt0.

ALT Infographic: Acre, Brazil sets CEMAF Resolution 3/2026, effective Oct 27 2026, for environmental licensing of farms bordering homologated Indigenous lands. Not an EUDR change. Card: approved 8 Oct, in force 27 Oct, DOE/AC 14.381. Four rules: monitoring programme may be required; FUNAI/INCRA boundaries prevail; SIGEF alone insufficient; FUNAI must be notified. Map of Brazil with Acre highlighted. Research by @silvermanCrypt0.

ALT Infographic over a dimmed photo of a tractor harvesting grain: 'EU-27 agree their line on the next CAP. The money is still open.' A map highlights all 27 EU member states, which unanimously approved the Council's partial negotiating position on the 2028-2034 Common Agricultural Policy on 26 Oct 2026. It sets one fund replacing the two-pillar CAP, degressive area-based income support (DABIS), a mandatory active-farmer definition, extra support for young farmers and crisis payments incl. animal and plant disease. Still open: about 300 billion euros the Commission proposed to ringfence (a proposal, not agreed), plus final allocation, degressivity and capping, tied to the EU budget deal (MFF). Timeline: proposal 2025, Council position 26 Oct 2026, talks with Parliament, MFF deal, CAP 2028-2034. Sources: Council of the EU, Irish Department of Agriculture. Research by @silvermanCrypt0.

ALT Infographic labelled ANALYSIS over a dimmed photo of cattle on Namibian savanna: 'Namibia's FMD outbreak is confined to 18 farms. Market access is the cost.' Region-level map highlights ǁKharas (SAT1 foot-and-mouth disease confirmed 23 Sep) and Zambezi (confirmed 6 Oct); outbreak sites not plotted. ǁKharas, ministry figures: 93 farms inspected within 50 km, 18 infected, 131 animals positive (unchanged since 15 Oct), 18 roadblocks. Compulsory vaccination: 1,296 of about 13,000 targeted cattle by 21 Oct, about 10% of the first round; 42,286 cattle vaccinated in Zambezi. Ministry: no legal provision to compensate farmers for disease losses. Timeline: WOAH suspended FMD-free status from 22 Sep; EU suspension in the Official Journal 5 Oct; vaccination from 17 Oct. Sources: veterinary notification No. 20, ministry update 21 Oct via NBC and NAMPA, EU Delegation statement. Research by @silvermanCrypt0.

ALT Infographic over a blurred photo of Ethiopian coffee beans in baskets: 'Ethiopia's coffee authority disputes ODI's EUDR exclusion warning'. ODI study, Oct 16, 2026, upper-bound estimates from data over a year old: up to 57% of supply chains with traceability gaps; up to 60% of smallholders could be excluded; $453M worst-case export loss; 23% of coffee land geolocated by July 2024 (about 200,000 of 860,000 ha). ECTA response to Capital, Oct 25, 2026, claims not independently verified: over 99% of coffee farms deforestation-free; GIZ-backed traceability platform operational; buyers in Germany, Italy, France, Belgium and Switzerland given data access. Map of Ethiopia: coffee export earnings over $3B in FY2025/26 (ECTA); about 30% of exports go to the EU (ODI). Timeline from July 2024 mapping to EUDR application on Dec 30, 2026 (large firms) and Jun 30, 2027 (small firms). Research by @silvermanCrypt0.

ALT Infographic over a dimmed illustrative photo of haze over Singapore: 'Singapore sends haze-law notices to 10 local palm and pulp firms'. NEA, Transboundary Haze Pollution Act, Oct 23, 2026. Big number: 10 Singapore-registered palm oil and forestry firms served Section 10 notices to provide documents and information, an investigative step, not a finding. Three things NEA wants: links with associated firms in Singapore and Indonesia; locations of land concessions they own; fire prevention and firefighting this dry season. Map: Singapore marked; Sumatra fires behind Section 9 preventive notices to 7 Indonesian firms on Oct 16; Kalimantan fires behind notices to 3 firms on Oct 19. List of the 10 firms: Asia Pulp & Paper Company, APP Company (China), Bumitama Agri, Golden Agri International, First Resources, Indofood Agri Resources, Kencana Agri, TSH Global Plantation, TSH Oversea, Wilmar International. Research by @silvermanCrypt0.

ALT Infographic over a dimmed illustrative photo of processing tomatoes: 'Brazil adds irrigated industrial tomatoes to ZARC zoning'. MAPA, Portaria SPA/MAPA 378 of Oct 20, published Oct 23, 2026. Three tiles: ZARC loss-risk classes of 20%, 30% and 40%, modelled probability of production loss, not observed losses. Industrial tomato output 2025: 1.88 million tonnes; 40% of Brazil's tomatoes go to industry. Map of Brazil: Goiás 65% of production, Minas Gerais 17%, São Paulo 16%, Pernambuco 2%. Chain: ZARC sowing window, sow inside the window, access to Proagro, rural insurance subsidy and rural credit tied to ZARC dates. Box: potential Dimitra use, hypothesis, dated plot and sowing records; no integration or contract confirmed. Note: tomatoes are not an EUDR commodity. Research by @silvermanCrypt0.

ALT Infographic over a dimmed illustrative photo of forest fires at night: 'Hotspots fall 76.3% in a day, but South Sumatra rises 75.9%'. Indonesia high-confidence fire hotspots from SiPongi, 23 Oct vs 24 Oct at 21:00 WIB. Paired bars per area with percent change: Indonesia 1,336 to 317, minus 76.3%; South Sumatra, highlighted in orange, 58 to 102, plus 75.9%; Central Kalimantan 785 to 60, minus 92.4%; West Kalimantan 184 to 55, minus 70.1%; Jambi 46 to 9, minus 80.4%; South Kalimantan 30 to nil; Riau nil both days. Map of Indonesia with priority provinces: South Sumatra orange as the riser, others green. Three-step strip: satellite alert, plot-level triage, ground check. Box: potential Dimitra use, hypothesis; no integration, EUDR breach, crop loss or DMTR revenue confirmed. Hotspots are not fires, burned area or deforestation. Research by @silvermanCrypt0.