

Unlock the power of precision and elevate your trading game with our comprehensive suite of cutting-edge tools. Whether you're a seasoned trader or just started
Wall St
Joined May 2018
- Tweets1.3K
- Following502
- Followers1.2K
- Likes19.2K
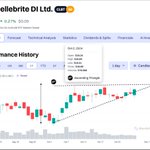






📐 $CLBT Ascending Triangle Formation
$CLBT has been showing strength with an ascending triangle pattern, indicating a potential bullish breakout on the horizon. The upper resistance level at $18.80 will be key to watch.
🔗 View $CLBT's page on Stocklytics
buff.ly/3Yu1hTa
#AscendingTriangle #CLBT

🌟 $CNP Golden Cross Alert
$CNP hit a bullish Golden Cross today, where the 50-SMA moved above the 200-SMA. This often points to a long-term upward trend — energy sector strength, anyone?
🔗 Explore $CNP Analysis
buff.ly/3Yq6nzV
#GoldenCross

📉 Today, $HOG saw a Death Cross pattern form, which can indicate potential downward momentum. Despite recent fluctuations, Harley-Davidson remains a stable player in the Consumer Cyclical sector, with a positive ROE of 20.14% and a consistent dividend yield of 2.17%. With a solid market presence, the company maintains a healthy debt-to-equity ratio of 2.2, showing sound financial management.
As always, staying informed on market trends and company performance is key. Read the full AI analysis: Access HOG AI Analysis.
buff.ly/3UxGoFx
#HarleyDavidson #StockAnalysis #ConsumerCyclical

💀 $HOG Death Cross Formation
$HOG saw a bearish Death Cross today, as the 50-SMA crossed below the 200-SMA, signaling potential downward pressure ahead. Keep an eye on Harley-Davidson’s movement as this trend unfolds.
🔗 Check $HOG Analysis on Stocklytics
buff.ly/3NIIrCS

📈 $ELF has officially formed an Ascending Triangle pattern today! This formation often hints at a potential bullish breakout, as the stock has shown resilience near $116.10 resistance.Details:
Volume: 3.45M
Close: $109.03
With its high growth profile and robust market presence, $ELF could be set for upward momentum. Keep an eye on it for potential moves above the breakout level!
🔗 buff.ly/3AgSL1T
#ElfBeauty #AscendingTriangle #BullishBreakout #Stocklytics

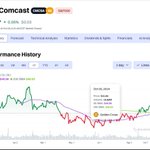
✨ Golden Cross sighting for $CMCSA! Today's crossover where the 50-SMA rises above the 200-SMA is typically seen as a bullish signal. Details:
Price: $41.84
Volume: 15.62M
With consistent performance and positive growth indicators, $CMCSA may be positioning itself for further upside.
🔗 buff.ly/3Yqxdrv
#Comcast #GoldenCross ✨ #Bullish

🚨 Death Cross alert for $NVCR!
Today, we observed a crossover where the 50-SMA dipped below the 200-SMA, often a bearish signal. 📉 Details below:
Price: $16.62
Volume: 1.06M
While $NVCR has shown past growth, this indicator calls for cautious optimism as we monitor how it reacts in the coming days.
buff.ly/3NKIduW
#Novocure #DeathCross ❌ #BearishSignal #Stocklytics

$CMCSA AI Analysis 📈
Today, a Golden Cross pattern emerged for $CMCSA, a bullish technical signal that may indicate potential upward momentum. With a $160.94B market cap and a 2.98% dividend yield, Comcast shows strong fundamentals. Notably, the company’s 17.49% return on equity and an analyst forecast of an 11.28% price increase support its growth potential, aligning with today’s positive signal.
👉 Access full insights: buff.ly/3YslUiu
#Comcast #StocklyticsAI #GoldenCross #Finance #Stocks

Intel ($INTC) Descending Triangle 🔽
We’ve been monitoring $INTC as it formed a Descending Triangle, a pattern that usually hints at bearish momentum. Today, there was a significant breakout from this pattern, which could confirm the downtrend. Last week, we pointed out the formation phase, and now the pattern has unfolded. This development could mean continued caution for investors.
📊 For more details, visit: buff.ly/3UoUER0
#DescendingTriangle #INTC #Semiconductors #BreakoutPattern #Stocklytics

Adobe ($ADBE) Death Cross ❌
A bearish Death Cross has emerged for $ADBE as its 50-day SMA has fallen below the 200-day SMA. Adobe's stock has been under pressure, down 8.20% over the past year. Traders should monitor closely for potential further declines.
🔍 Explore more: buff.ly/3YDaIB0
#DeathCross #ADBE #TechStocks #BearishTrend #Stocklytics

Masimo ($MASI) Golden Cross ✨
$MASI has formed a Golden Cross, with the 50-day SMA crossing above the 200-day SMA. This bullish signal comes after a year of steady gains, showing a 73.96% growth. Investors may want to watch closely for continued upward momentum.
📈 Check full details at: buff.ly/3Aou8jK
#GoldenCross #MASI #HealthcareStocks #BullishSignal #Stocklytics

Adobe ($ADBE) has recently shown a "Death Cross" pattern on its chart, where the 50-day moving average fell below the 200-day moving average, often viewed as a bearish signal. This development, alongside Adobe's latest quarterly results, could indicate caution for investors.
AI Analysis: Despite the recent technical signal, Adobe remains fundamentally strong. It boasts a market cap of $213.51B, a robust net margin of 27.97%, and a return on equity of 35.36%. With consistent revenue growth and a low debt-to-equity ratio, Adobe’s market position in the technology sector continues to be favorable. Its quality industry and sector scores further highlight its long-term growth potential.
buff.ly/3YBMI1b
#Adobe #StockMarket #Investing #AIAnalysis #DeathCross

🚨 Intel AI Analysis Update: Key Insights & Technical Watch 🚨
Intel $INTC stands as a stable option in the tech sector, with a market cap of $93.99B and a dividend yield of 2.23%. The company shows solid fundamentals: $206.2B in assets, a manageable debt-to-equity ratio of 0.44, and a positive net margin of 3.11%. Analysts see a potential 16.42% price increase ahead. 🔍
However, Intel's recent Descending Triangle pattern indicates caution. Often seen as a bearish sign, this could mean potential downward pressure on its stock, making it essential to monitor any upcoming movements.
👉 buff.ly/3UoUER0
#Stocklytics #Intel #AIAnalysis #DescendingTriangle #StockMarket #InvestmentInsights

🔽 Descending Triangle Alert!
Intel $INTC formed a Descending Triangle pattern on September 27, 2024. Traders should keep an eye on possible breakout movements. 🔎
👉 buff.ly/3UoUER0
#Stocklytics #Intel #DescendingTriangle #StockTrading #TechnicalAnalysis

✨ Golden Cross Alert!
Viad $VVI just experienced a Golden Cross on October 24, 2024, suggesting potential bullish momentum. 📈
👉 buff.ly/48okIBl
#Stocklytics #Viad #GoldenCross #BullishSignal #StockTrading #InvestmentInsights

❌ Death Cross Alert!
Shell plc $SHEL just signaled a Death Cross on October 24, 2024, which could indicate a bearish trend ahead. 📉
👉 buff.ly/4ffO3QO
#Stocklytics #Shell #DeathCross #BearishSignal #StockTrading #TechnicalAnalysis

🚀 Herc Holdings $HRI AI Analysis Now Available!
Stocklytics' report highlights HRI as a promising investment, with a 22.93% 7-day price gain and strong 41.74% YTD growth. With a solid PE ratio, 27.52% ROE, and trending as a top gainer today, Herc is well-positioned for future success.
👉 buff.ly/3YAykGn
#Stocklytics #HercHoldings #AIAnalysis #IndustrialStocks #InvestmentInsights

✨ Golden Cross Alert!
Dropbox $DBX just hit a Golden Cross on October 23, 2024, suggesting potential upward momentum! 📈
👉 buff.ly/3NGsYmV
#StockMarket #Dropbox #GoldenCross #BullishSignal #StockTrading #Stocklytics #InvestmentTips

❌ Death Cross Alert!
Olo $OLO just signaled a Death Cross on October 23, 2024, hinting at possible bearish momentum. 📉
👉 buff.ly/3YmygZA
#StockMarket #Olo #DeathCross #BearishSignal #StockTrading #Stocklytics #TechnicalAnalysis

✨ Golden Cross Alert!
Webster Financial $WBS just formed a Golden Cross on October 22, 2024, suggesting bullish momentum ahead! 📈
👉 buff.ly/4hkWP1V
#StockMarket #WebsterFinancial #GoldenCross #BullishSignal #StockTrading #Stocklytics #InvestmentTips
