

NCFM (NSE) certified | Investment Analyst Pro | NCMP Cleared | Technical + Fundamental Analyst | Equity & Derivatives analyst | BANKNIFTY | SEBI Unrgd.
Joined December 2021
- Tweets8.3K
- Following57
- Followers35.5K
- Likes21.4K




Pinned Tweet
“Believe in yourself. You are braver than you think, more talented than you know."
NCFM (NSE) certified:-
1. Investment analyst Pro
2. NCMP Level 1 cleared
3. Technical analyst
4. Equity & Derivatives analyst
5. Fundamental analyst
6. Investment & Portfolio management analyst


Wishing everyone a blessed, joyful, and peaceful Bhai Dooj!
May the warmth of this festive season brighten every moment for you and your family. 🪔✨💛
— Yukti Agrawal

2
16
1,914
Happy diwali ✨ 🔥
मां लक्ष्मी की कृपा से आंगन में ऋद्धि-सिद्धि का वास हो, और जीवन का हर कोना खुशियों के उजाले से जगमगा उठे।
शुभ दीपावली! ✨
#Diwali

13
48
2,412
Guys, need your suggestions for my little princess's name! ❤️
As per her Nakshatra, the suggested starting letter is "Ni" (नी).
Looking for a name with a beautiful, deep and meaningful significance.
Drop your suggestions! ❤️
#girl_name

🙏 A Little Goddess Has Arrived! ❤️🪷
On 14th October, Yukti Ma’am and Krishna Sir were blessed with a beautiful baby girl. 👶🏻💖
During these auspicious days of Nav Durga, Maa Lakshmi herself has arrived at their home in the form of a little princess. 🪷✨
👑 It’s a Girl! 💕
Regular updates will resume from Monday.
Thank you for your love, blessings, and support. ❤️🙏
@_krishnasoni

Yukti Agrawal (@Stockstix) retweeted
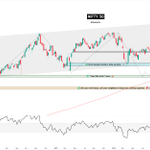
NIFTY 50 🤔
Is this a genuine trend reversal or just a relief rally? 📉
🌍 Trump’s midterm setback and the global rally gave us the gap-up headline move. But what does the chart actually tell us?
Looking at the recent upmove, many of you might feel that I'm being too bearish or simply taking a contrarian view.
But I'm not bearish just for the sake of being bearish. I'm focusing on the broader chart structure, resistance zones, and weekly momentum.
🚧 THE REALITY CHECK
Immediate Resistance: 24,200–24,420
📍 FVG retest followed by rejection.
📉 Bearish Quasimodo structure remains intact.
📊 Weekly RSI is facing resistance around the 60 zone.
📉 THE AVWAP FACTOR
Adding to the caution, the Anchored VWAP from the swing low is currently sitting nearly 5–6% below CMP.
This suggests that price is significantly stretched from its anchored mean, increasing the risk of mean reversion towards our first major demand zone at 22,400–22,800.
⚠️ My View: I remain cautious at these levels.
#Nifty50 #TrumpOut

⛔ Global markets are showing significant weakness:
* GIFT NIFTY facing rejection.
* NASDAQ: Down nearly 4%.
* Silver: Sharp decline.
* Crude Oil: Moving higher.
* CHIP STOCKS: Down 10–18%.
* CRYPTO: Sharp sell-off.
#StockMarketindia #Nifty50
NIFTY 50 🤔
Is this a genuine trend reversal or just a relief rally? 📉
🌍 Trump’s midterm setback and the global rally gave us the gap-up headline move. But what does the chart actually tell us?
Looking at the recent upmove, many of you might feel that I'm being too bearish or simply taking a contrarian view.
But I'm not bearish just for the sake of being bearish. I'm focusing on the broader chart structure, resistance zones, and weekly momentum.
🚧 THE REALITY CHECK
Immediate Resistance: 24,200–24,420
📍 FVG retest followed by rejection.
📉 Bearish Quasimodo structure remains intact.
📊 Weekly RSI is facing resistance around the 60 zone.
📉 THE AVWAP FACTOR
Adding to the caution, the Anchored VWAP from the swing low is currently sitting nearly 5–6% below CMP.
This suggests that price is significantly stretched from its anchored mean, increasing the risk of mean reversion towards our first major demand zone at 22,400–22,800.
⚠️ My View: I remain cautious at these levels.
#Nifty50 #TrumpOut
NIFTY 50 🤔
Is this a genuine trend reversal or just a relief rally? 📉
🌍 Trump’s midterm setback and the global rally gave us the gap-up headline move. But what does the chart actually tell us?
Looking at the recent upmove, many of you might feel that I'm being too bearish or simply taking a contrarian view.
But I'm not bearish just for the sake of being bearish. I'm focusing on the broader chart structure, resistance zones, and weekly momentum.
🚧 THE REALITY CHECK
Immediate Resistance: 24,200–24,420
📍 FVG retest followed by rejection.
📉 Bearish Quasimodo structure remains intact.
📊 Weekly RSI is facing resistance around the 60 zone.
📉 THE AVWAP FACTOR
Adding to the caution, the Anchored VWAP from the swing low is currently sitting nearly 5–6% below CMP.
This suggests that price is significantly stretched from its anchored mean, increasing the risk of mean reversion towards our first major demand zone at 22,400–22,800.
⚠️ My View: I remain cautious at these levels.
#Nifty50 #TrumpOut
Yukti Agrawal (@Stockstix) retweeted
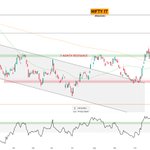
NIFTY IT | THE BIG TREND REVERSAL IS UNFOLDING? 🚀
A 7-month resistance zone is finally being challenged, and the technical structure is looking increasingly bullish.
After spending several months inside a prolonged downward channel, NIFTY IT has staged a sharp recovery and moved above its major moving averages.
What makes this setup interesting?
7-Month Resistance: Price has broken above the 31,500–31,900 resistance zone.
Channel Breakout: A prolonged downward channel has been breached, signalling a potential trend reversal.
Golden Crossover Setup: 50 DMA is currently around 30,051, while 200 DMA is around 30,578. The gap is narrowing, keeping a Golden Crossover on the radar.
Momentum: RSI is at 59, indicating improving momentum without entering the overbought zone.
Upside levels to watch:
🎯 35,013 — First major target
🎯 37,745 — Next major target
The bigger picture:
If the breakout sustains and the moving averages eventually confirm a Golden Crossover, NIFTY IT could be setting up for a much larger structural uptrend.
IT sector deserves a close watch in the coming weeks.
#NIFTYIT

NIFTY IT | THE BIG TREND REVERSAL IS UNFOLDING? 🚀
A 7-month resistance zone is finally being challenged, and the technical structure is looking increasingly bullish.
After spending several months inside a prolonged downward channel, NIFTY IT has staged a sharp recovery and moved above its major moving averages.
What makes this setup interesting?
7-Month Resistance: Price has broken above the 31,500–31,900 resistance zone.
Channel Breakout: A prolonged downward channel has been breached, signalling a potential trend reversal.
Golden Crossover Setup: 50 DMA is currently around 30,051, while 200 DMA is around 30,578. The gap is narrowing, keeping a Golden Crossover on the radar.
Momentum: RSI is at 59, indicating improving momentum without entering the overbought zone.
Upside levels to watch:
🎯 35,013 — First major target
🎯 37,745 — Next major target
The bigger picture:
If the breakout sustains and the moving averages eventually confirm a Golden Crossover, NIFTY IT could be setting up for a much larger structural uptrend.
IT sector deserves a close watch in the coming weeks.
#NIFTYIT
Yukti Agrawal (@Stockstix) retweeted
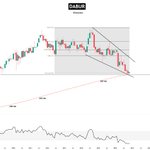
🔥 DABUR
I’m Accumulating.
Dabur is much more than an Ayurvedic company. Its portfolio spans Healthcare, Oral Care, Hair Care, Foods & Beverages, Skin Care and Home Care, with brands like Dabur Amla, Vatika, Real, Dabur Red and Chyawanprash.
The valuation reset is what makes it interesting:
📊 P/E: 33x vs historical median of 41.5x
📊 Market Cap/Sales: 4.9x vs median of 6.2x
📊 EV/EBITDA: 20-21x vs median of 29.6x
P/E, Market Cap/Sales and EV/EBITDA are all back to levels last seen around 2012-14, while EBITDA is now about 2.5x higher.
Fundamentals are not deteriorating (Q1 FY27):
✅ Revenue: ₹3,764 cr (+10.6% YoY)
✅ Net profit: ₹591 cr (+15% YoY)
✅ EBITDA: ₹741 cr (+11% YoY), margin 19.7%
✅ Last 4 quarters: revenue ₹13,550 cr, net profit ₹1,970 cr
📉 Technically (monthly chart):
Stock is down about 45% from the ₹672 high
Monthly RSI at 31, near oversold
Price is sitting on a confluence of support at ₹355-366: 200-month MA (₹355), 1.618 Fib extension (₹365) and a horizontal support (₹357)
Price is also testing the lower end of a falling wedge
#Dabur #ValueInvesting #StockMarket
Disclaimer: For educational purposes only. Not investment advice or a recommendation to buy or sell any security.

🔥 DABUR
I’m Accumulating.
Dabur is much more than an Ayurvedic company. Its portfolio spans Healthcare, Oral Care, Hair Care, Foods & Beverages, Skin Care and Home Care, with brands like Dabur Amla, Vatika, Real, Dabur Red and Chyawanprash.
The valuation reset is what makes it interesting:
📊 P/E: 33x vs historical median of 41.5x
📊 Market Cap/Sales: 4.9x vs median of 6.2x
📊 EV/EBITDA: 20-21x vs median of 29.6x
P/E, Market Cap/Sales and EV/EBITDA are all back to levels last seen around 2012-14, while EBITDA is now about 2.5x higher.
Fundamentals are not deteriorating (Q1 FY27):
✅ Revenue: ₹3,764 cr (+10.6% YoY)
✅ Net profit: ₹591 cr (+15% YoY)
✅ EBITDA: ₹741 cr (+11% YoY), margin 19.7%
✅ Last 4 quarters: revenue ₹13,550 cr, net profit ₹1,970 cr
📉 Technically (monthly chart):
Stock is down about 45% from the ₹672 high
Monthly RSI at 31, near oversold
Price is sitting on a confluence of support at ₹355-366: 200-month MA (₹355), 1.618 Fib extension (₹365) and a horizontal support (₹357)
Price is also testing the lower end of a falling wedge
#Dabur #ValueInvesting #StockMarket
Disclaimer: For educational purposes only. Not investment advice or a recommendation to buy or sell any security.
👉Silver ( XAGUSD )
Silver is showing a classic Bull Trap setup 📉
A small bounce will make it feel like “back to normal”…
but that’s usually where the real selling starts.
Stay patient. Don’t chase the bounce. ✅
#mcxsilver #xagusd

4
24
3,356
Yukti Agrawal (@Stockstix) retweeted
FPIs’ sectoral data is out! 🔥
The IT sector saw the highest FPI buying last month, while Financial Services witnessed the highest selling. 👀
Perfect sector rotation as planned
#NIFTYIT #HCLTECH #tcs
NIFTY IT / NIFTY 50 🔥
RATIO CHART
Something interesting is setting up 👇
• Long-term cyclical downtrend since 2021
• Ratio has formed a descending channel
• Price is now testing the ₹1.30 breakout zone
• 40 EMA (W) almost aligned with the 200 DMA, making this zone even more important
• RSI has reclaimed 50 and is approaching its breakout zone
If this breakout sustains, the next 2–3 months could see some strong moves in IT stocks. 🚀
The ratio chart is already indicating around 24% relative outperformance potential.
#NIFTYIT #HCLTECH #TCS #stockmarketindia

Yukti Agrawal (@Stockstix) retweeted
Silver crashing 🔥🔥
#XAGUSD
👉Silver ( XAGUSD )
Silver is showing a classic Bull Trap setup 📉
A small bounce will make it feel like “back to normal”…
but that’s usually where the real selling starts.
Stay patient. Don’t chase the bounce. ✅
#mcxsilver #xagusd
FPIs’ sectoral data is out! 🔥
The IT sector saw the highest FPI buying last month, while Financial Services witnessed the highest selling. 👀
Perfect sector rotation as planned
#NIFTYIT #HCLTECH #tcs
NIFTY IT / NIFTY 50 🔥
RATIO CHART
Something interesting is setting up 👇
• Long-term cyclical downtrend since 2021
• Ratio has formed a descending channel
• Price is now testing the ₹1.30 breakout zone
• 40 EMA (W) almost aligned with the 200 DMA, making this zone even more important
• RSI has reclaimed 50 and is approaching its breakout zone
If this breakout sustains, the next 2–3 months could see some strong moves in IT stocks. 🚀
The ratio chart is already indicating around 24% relative outperformance potential.
#NIFTYIT #HCLTECH #TCS #stockmarketindia
Silver crashing 🔥🔥
#XAGUSD
👉Silver ( XAGUSD )
Silver is showing a classic Bull Trap setup 📉
A small bounce will make it feel like “back to normal”…
but that’s usually where the real selling starts.
Stay patient. Don’t chase the bounce. ✅
#mcxsilver #xagusd
Yukti Agrawal (@Stockstix) retweeted
👉Silver ( XAGUSD )
Silver is showing a classic Bull Trap setup 📉
A small bounce will make it feel like “back to normal”…
but that’s usually where the real selling starts.
Stay patient. Don’t chase the bounce. ✅
#mcxsilver #xagusd
Yukti Agrawal (@Stockstix) retweeted
NIFTY IT 🔥
18% straight rally.
Stocks up 20–25% from their lows.
Moving exactly as per plan.
A weekly close above this zone could open the door for the next leg up and confirm a potential CHoCH. 🚀
#NIFTYIT #NIFTY50

NIFTY IT setup 🟢
The structure is pretty clear here.
We had a BOS → HH → LH → LL sequence, and price has now reached the 28,900–29,050 zone, where a potential Higher Low (HL) can form.
Another important point: price is currently sitting around the 100-DMA, making this zone even more important.
If this zone holds and we get a bullish reversal → 31,290 is the first major hurdle, followed by the 3-month high at 32,134.
A clean breakout above 32,134 can open the door towards ~34,950.
For now, 29K + 100-DMA is the key zone.
Hold it → bullish structure can rebuild.
Disclaimer: This is for educational and informational purposes only and should not be considered financial or investment advice. Markets are subject to risk. Please do your own research
#NIFTYIT #Coforge #NIFTY50 #NIFTYIT
