



I won’t recap you guys with the earning call numbers of $GOOGL and $AMZN that you already saw many times today. But I want you to look deeper than that.
Alphabet (Google)
- Revenue still accelerating: +25% to $127.6B (13th straight double-digit growth quarter), now at a ~$500B annual run rate.
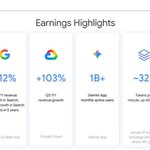
- Cloud is a standout: +103% to $30.7B with operating margin expanding sharply to 36.2% and a $561B backlog. TPU system sales and AI infrastructure/solutions are major drivers.
- Search and consumer platforms healthy: Highest year-over-year query growth in five years (including commercial queries); Gemini app at 1B users; model API usage ~32B tokens/minute (up 40% QoQ and >4x YoY); YouTube Music & Premium >150M subscribers.
- Profitability intact at the operating level: Operating income +30% to $40.6B (31.8% margin). The EPS decline and cash burn stem mainly from unrealized investment losses and massive AI-related capex (~$51B in the quarter; full-year 2026 still $195–205B, with more expected in 2027).
- Demand signals positive: Management emphasized strong AI-driven usage, capacity constraints, and continued expansion of AI features (Overviews, AI Mode, agents).
Amazon
- Revenue and margins expanding: Sales +12% to $201.9B (Prime Day timing shift reduced reported growth ~400 bps). Operating income +61% to $28.1B with a record 13.9% operating margin.
- AWS accelerating: +39.3% to $46B (fastest growth in nearly five years, sixth consecutive quarter of acceleration), ~$184B annualized run rate, and $578B backlog. Management guided to >40% growth in both 2027 and 2028 and sees a path to a $1T revenue business in 5–10 years. AI infrastructure, Bedrock, and custom chips are key contributors; capacity is largely sold out near-term.
- Retail and ads stable-to-improving: Advertising expected to return to high-teens growth in Q4; retail seeing better margins, faster delivery, and share gains. Newer areas (grocery, pharmacy, Prime Video at a “tens of billions” run rate and profitable) progressing.
- Cash flow pressure is investment-driven: TTM free cash flow down to a $42.4B outflow due to AI/property & equipment spending (~$76–77B in the quarter; full-year 2026 ~$220B, with more in 2027). Operating cash flow still grew strongly.
Both companies are generating robust growth in their business with solid operating margins. The “problem” is the scale and duration of AI infrastructure investment required to meet demand, which is currently producing negative free cash flow and making investors nervous about payback timing. That is a capital allocation debate, not evidence that the businesses are broken.
$GOOGL dumped -10% post-earnings despite revenue surging +25% YoY.
Wall Street is panicking over headline cash burn, but look past the noise—Google is turning into an absolute AI compute company.
• Top-Line & Core Margins: Total revenue hit $127.6B (+25% YoY) with an overall 31.8% operating margin. While GAAP EPS missed ($2.12 vs $3.02) due to a -$8.7B unrealized paper loss on equity investments ($SPCX), core operating income actually grew +30% YoY to 40.6B.
• Cloud Profitability Explodes: Google Cloud doubled +103% YoY to $30.7B, while operating profit tripled to $11.1B (36.2% margin). Cloud is no longer just scaling—it’s generating elite cash margins while taking market share from AWS and Azure.
• The $561B Contract Backlog: Cloud backlog surged to a staggering $561 Billion. Management confirmed that >55% will convert into recognized revenue within the next 24 months, with the largest wave arriving in 2027.
• Management Said: Sundar Pichai announced that Gemini officially crossed 1 Billion users (the fastest product to scale in Google history). AI search queries are expanding at a 5-year record pace, API volume hit 32B tokens/min (+4x YoY), and 100+ tier-1 enterprise clients are now deploying custom TPU systems.
• Outlook: Quarterly CapEx surged +114% YoY to $51.4B, pushing Free Cash Flow into the red at -$9.1B. Management reaffirmed FY26 CapEx at $195B–$205B and guided that 2027 CapEx will increase significantly to support surging TPU and compute demand before commercial deliveries kick in.
The AI bet is showing up in usage and Cloud revenue, which is the bull case. The bear case is that the cash burn is intense, ad monetization is lagging the usage gains, and returns on the massive CapEx still need to prove out. One soft quarter doesn’t break the thesis, especially with a one-time equity hit, but the market is correctly demanding clearer evidence that the spending is translating into durable, high-margin growth rather than just more capacity. Long-term, their full-stack position (models, chips, Cloud, distribution via Search/YouTube/Android) remains one of the strongest in AI; the next few quarters will test whether that advantage compounds faster than the costs.


Seeing people panic over the "AI Credit Crunch" is ridiculous.
Put these two charts side-by-side and tell me where the catastrophe is
• Strip out $ORCL, $SPCX, & $AVGO : The only visible stress is ORCL (341 bps), SpaceX (241 bps), and AVGO (159 bps).
• Core Hyperscalers and Semis are barely moving: $MSFT is sitting at just 56.9 bps, $AMZN at 82.1 bps, and $AMD at 114.7 bps. $GOOGL, $META, and $NVDA are practically flatlining together under 100 bps at the bottom. In credit terms, that's an insurance cost of ~0.5%–1%—literally a rounding error.
• Drowning in a $500B cash moat: The second chart shows combined cash and equivalents across Alphabet, Microsoft, Meta, and Amazon hitting an all-time record above $500 Billion in 2026. Alphabet alone is sitting on over $200B
• Growth CapEx vs. survival debt: They aren't borrowing to keep the lights on; they're building infrastructure backed by massive backlogs. If they ever decide to pause CapEx, the Free Cash Flow faucet instantly explodes higher.
Conflating overleveraged GPU rental middlemen with monopolies sitting on half a trillion in cold hard liquidity is very nonsense.
If a 50–80 bps CDS on companies holding $500B in cash makes you scared, just put your money in a savings account.


Many people say today is gonna be the black monday. No f*cking way! It’s very nonsense and ridiculous rumor.

The AI sell-off isn’t a demand crash. It’s a Neocloud $CRWV $IREN $NBIS $ORCL debt crisis.
When rates stay high, middlemen running on junk debt and brutal hardware depreciation with zero real profits get wiped out.
Look at the ugly math behind the $CRWV meltdown dragging the whole sector down:
• The "Adjusted" Profit Illusion: They brag about $1.5B in Q2 Adjusted EBITDA, while casually ignoring $1.4B in GPU depreciation and $640M in quarterly interest. Interest alone eats 25% of revenue. They aren't profitable—they're bleeding cash.
• Drowning in Junk Debt: $51B in total obligations (10.6x Debt/EBITDA, B+ junk rating). YTD CapEx is $14.1B vs. just $3.6B in operating cash flow, with a ~$10B net debt wall due in the next 12 months.
• Bond Market is Screaming: Their 2031 bond yields just spiked to 15.78% (<80 cents on the dollar), and 5Y CDS prices in a >50% default risk. At 15% debt costs, data center margins get cut in half overnight.
• Fatal Maturity Mismatch: Taking on long-term high-yield debt backed by GPUs that go obsolete in ~6 years, while top AI tenants demand 90-day cancellable leases.
• Massive Red Flags: Management literally hid the balance sheet and cash flow statement from their Q3 investor deck while insiders dumped hundreds of millions in shares over the last 2 weeks.
The crazy part? Real AI demand is still on fire:
• GPU rental rates are surging: B300 up +50% YTD, B200 +35%, and even old H100s up +27%.
• $AMZN hiked reserved GPU prices 3x this year (+59% YTD).
• $TSM & $ASML just confirmed chip shortages stretching into 2029–2030.
The AI buildout isn't dying. Overleveraged GPU landlords with zero moat are just hitting a financing wall.
Own fortress balance sheets ($MSFT, $AMZN, $GOOGL ,$TSM). Fade the debt-fueled middlemen.
Business is so strong, capacity is not enough, order is coming in continually without price negotiation.
Focus on business fundamental not stock price, the stock price will follow the fundamental in the long run without any condition.

TSMC $TSM Q3’26 EARNINGS HIGHLIGHTS
🔹 Revenue: $46.72B (Est. $44.93B) 🟢; +41.2% YoY
🔹 EPS: $4.60 (Est. $4.48) 🟢; per ADR
🔹 Gross Margin: 66.4% (Est. 66.3%) 🟡
🔹 Oper Margin: 58.7% (Est. 57.7%) 🟢
🔹 Net Income: NT$763.06B (Est. NT$737.9B) 🟢
🔹 Net Profit Margin: 51.1%
Revenue by Platform:
🔹 HPC: 68%; +22% QoQ
🔹 Smartphone: 21%; +10% QoQ
🔹 IoT: 4%; +5% QoQ
🔹 Automotive: 4%; +23% QoQ
🔹 DCE: 1%; -12% QoQ
🔹 Others: 2%; -10% QoQ
Technology Mix (Wafer Revenue):
🔹 2nm: 8%
🔹 3nm: 33%
🔹 5nm: 28%
🔹 7nm: 10%
🔹 7nm and below: 79%
Other Q3 Metrics:
🔹 Wafer Shipments: 4,476 Kpcs; +9.6% YoY
🔹 North America: 79% of revenue
🔹 ROE: 45.5%
🔹 OpEx: 7.8% of revenue
🔹 Inventory Days: 82; -5 days QoQ
🔹 CapEx: $13.84B; $40.64B YTD
🔹 Free Cash Flow: NT$476.56B
Key Updates:
🔸 Gross margin was 1.3 ppts lower than 2Q26, primarily due to the margin dilution from the initial ramp-up of N2 technology.
🔸 Non-operating items were a gain of NT$34.59B, vs NT$95.83B in 2Q26, which included disposal and mark-to-market gains on VIS shares.
🔸 Diluted EPS NT$29.43 (+68.7% YoY); revenue NT$1,494.24B (+50.9% YoY)

To everyone still screaming "AI bubble"... if Big Tech is investing billions on data centers while customers have already signed binding contracts to buy the capacity, is that really a bubble?
Look at the 2026–2028 CapEx vs. locked-in backlog (RPO) and next year's growth pipeline:
• $GOOG : $894B CapEx vs. $514B Cloud backlog. Cloud revenue is up 82% YoY, and >50% of that massive backlog converts straight into cash over the next 24 months (mostly hitting in 2027).
• $MSFT : $679B CapEx vs. $678B backlog (+84% YoY)—literally 1:1 coverage. 30% (~$203B) turns into actual revenue in the next 12 months while they double data center capacity.
• $AMZN : $834B CapEx vs. $496B AWS backlog (>100% YoY). AWS is now a $169B run-rate monster. Their AI and custom Trainium chips are already printing $25B /year each (>100% YoY) with multi-GW deals locked in.
• $ORCL : $279B CapEx vs. a mind-blowing $638B backlog (+363% YoY). 12% hits the top line in the next 12 months, and another 34% in months 13–36. Best part? Clients prepaid ~$75B or brought their own GPUs. Zero balance sheet stress.
• $META : $583B CapEx vs. $349B in supplier commitments. They don’t even sell cloud to the public—they're locking down $349B in hardware just to supercharge their own AI ad engine.
In 2000, companies built dark fiber praying customers would show up. Today, hyperscalers can't even build data centers fast enough to fulfill the trillions in signed contracts sitting on their books.
Still calling this a bubble?

$ASML beats expectation!
Comment : our capacity cant meet demand soon and order of 2028-2030 is already going in.
There is a very long runway for AI trend. Just focus on the fact not emotional.
$ASML Q3’26 EARNINGS HIGHLIGHTS
🔹 Net Sales: €11,662M (Est. €11.56B) 🟢
🔹 EPS: €12.95 (Est. €10.60) 🟢
🔹 Gross Margin: 57.5% (Est. 54.8%) 🟢
🔹 Net Income: €5.0B (Est. €4.06B) 🟢
FY26 Guide:
🔹 Net Sales: €44B-€45B (Est. €43.73B) 🟢
🔹 Gross Margin: ~56% (Est. 54.0%) 🟢
Q4 Guide:
🔹 Net Sales: €14.2B-€15.2B (Est. €13.8B) 🟢
🔹 Gross Margin: ~57% (Est. 54.9%) 🟢
🔹 R&D Costs: ~€1.2B
🔹 SG&A Costs: ~€0.4B
Capital Return:
🔹 Share Buybacks: ~€4.1B in Q3
🔹 Interim Dividend: €1.88/share
Key Updates:
🔹 Supply as currently planned for both 2027 and 2028 will not fully meet customer demand
🔹 Investigating ways to increase capacity for 2028 beyond the 30% increase previously communicated

If you cant sleep well last night because of the AI stocks, it may be the time to think about diversification.

Weekend read:
If you hold ANY AI or chip stocks, $TSM earnings on Oct 15 is the only event that matters this week.
4 simple things to watch:
• Q4 Outlook & Pricing Power: Revenue was already up +50% YoY last quarter. If gross margins stay above 65%, it means Big Tech is paying whatever $TSM demands without condition.
• The Packaging Jam (CoWoS): $AMD and $NVDA want more AI chips than $TSM can package together. If packaging stays limited, it caps how fast AI chips can ship.
• The 2nm Race ($AAPL, $NVDA): Apple and Nvidia are racing to lock in 2nm capacity. Watch for good "yields" (chips that actually work). High yields mean fatter profit margins next year.
• The 64B+ Spending: TSMC is dropping over $60B on factory gear. If their 2027 capex budget goes up, equipment makers ($ASML , $AMAT) print cash, and OSAT partners like $AMKR get the spillover work.
If TSMC stays bullish, the entire AI supply-chain run isn't slowing down anytime soon.
OpenAI revenue missed by $20B! The Semi ($QQQ $SMH $SOXX) is collapsing 📉
The headline was an unverified pre-IPO leak. Meanwhile, actual chipmakers just reported audited, record-breaking demand:
• OpenAI : Never guided to $70B. Real run-rate actually grew from $40B in Aug ➔ $50B today (still compounding).
• $TSM : Q3 revenue hit an all-time high of $46.7B (+51% YoY). Over 75% of sales are locked in by North American tech giants.
• Samsung : Q3 operating profit surged 8x YoY as memory prices jumped 10–20% in a single quarter. S. Korea semi exports literally tripled.
• $AMD & Foxconn : AI server assembly beat estimates across the board, with multi-year backlogs stacking up.
Startup spreadsheet rumors are volatile, but physical foundries and advanced packaging lines are sold out for years.
Demand isn’t broken. Don’t panic-sells because of the ghost headlines. Know the difference between noise and balance sheet reality.


Instead of asking how high the 10y treasury yield is going to, why don’t we just prepare our portfolio to survive a high yield regime?
Do the test by filter
- Quality filter: Projected 12M forward EPS growth >15% + net positive earnings revisions over the last 90 days.
- The multiple compression: Assume consensus EPS hits, but sticky 5%+ yields force the market to slash their valuation 15% BELOW their 5Y/10Y historical average P/E.
Does projected EPS growth outrun valuation compression?
Here is how the stock in S&P 500 stacks up into 3 buckets 👇
2/ Half-Safe: Survives if P/E reverts to historical average, but cracks under a 15% discount.
These are solid businesses with decent buffers, but they cannot withstand a prolonged valuation squeeze:
• Tech & Communications: $GOOG, $TXN, $ON, $ANET, $TER, $T
• Consumer & Industrials: $SBUX, $GE, $PWR, $JBHT
• Financials & Pharma: $ABBV, $ELV, $C, $FITB, $RTX
They will hold up fine in a standard pullback, but if the 10Y yield camps near 5.5%, multiple contraction starts eating into their returns.
3/ Fragile: Even reverting to average P/E results in negative returns. Earnings growth cannot catch up.
Any slight multiple compression turns these into instant bagholder traps:
• Semi Equipment & Enterprise IT: $AMAT, $KLAC, $LRCX, $DELL, $NTAP, $HPE
• Cyclicals, Industrials & Energy: $CAT, $DE, $FDX, $CEG, $URI, $WDC, $HWM, $GILD, $WBD
Many of these are crowd-favorite AI and momentum plays. If discount rates stay elevated, this group faces the steepest de-rating.