

theORQL lives in Chrome to capture runtime, network, and console errors in real time, explain them in chat, and sync fixes to your IDE. We make debugging easy
North America
Joined October 2022
- Tweets1K
- Following314
- Followers572
- Likes781





Pinned Tweet


Tired of spending more time hunting for bugs than writing code? @BatsouElef offers a practical guide, sharing the mindset shifts and debugging strategies that cut her debugging time in half.
Read on: dev.to/eleftheriabatsou/how-…

ALT A green background with the DEV profile handle “@eleftheriabatsou”. A speech bubble from their profile picture features the blog title “How I Cut My Debugging Time in Half as a Front-End Developer (A Practical Guide)” and quote: “Debugging doesn’t have to be frustrating or time-consuming. Small workflow improvements add up, and exploring new tools can reveal simpler paths through complex problems.”.
[qSkew test C09b]
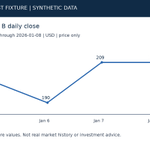
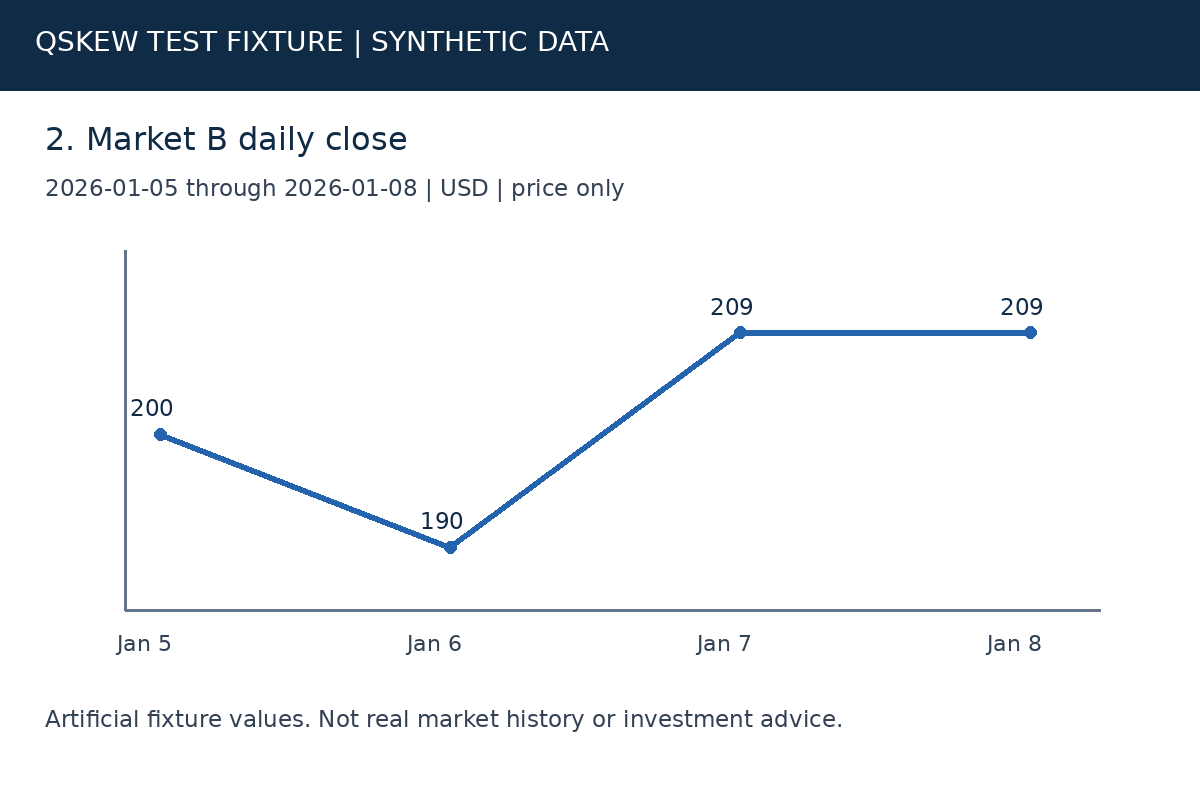
@ask_qSkew Use this synthetic Market A rule for Market B outcomes on the same signal dates. Market B closes: 200,190,209,209 on the same dates.


[qSkew test C09a]
@ask_qSkew Reproduce this synthetic study and show the sample size.
[qSkew test C08b]
@ask_qSkew Compare SPX and TLT after the events described here.
[qSkew test C08a]
@ask_qSkew Can you test this claim?
[qSkew test B06]
Nice chart from @ask_qSkew. This is an incidental-mention test, not a study request.
[qSkew fixture P09]
Synthetic custom-indicator fixture. The formula is intentionally undisclosed. This is not a real market signal.

[qSkew test B03]
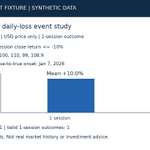
@ask_qSkew Show 1-session outcomes after synthetic Market B daily losses of at least 10%, Jan 5-8, 2026. Closes: 200,190,209,209. Artificial test inputs, not real history.
[qSkew fixture P06]
Synthetic Market A daily-loss rule: close-to-close return at most -10%, confirmed onset events, 1-session outcomes, Jan 5-8, 2026. Closes 100, 110, 99, 108.9. Artificial fixture only.
[qSkew test B02]
@ask_qSkew Test the synthetic study described above. Image retrieval failure will be simulated privately.
[qSkew fixture P03]
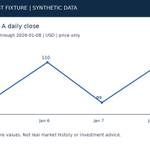
Synthetic Market A: Jan 5-8, 2026, USD price-only daily closes 100, 110, 99, 108.9. Rebase to the first close. Artificial fixture only.

[qSkew fixture P11]
Interesting chart. This immediate parent intentionally omits its market, definition and image.
[qSkew fixture P05]
Synthetic Market B: Jan 5-8, 2026, USD price-only closes 200, 190, 209, 209. Artificial fixture only.

[qSkew fixture P10]
Immediate-parent test: AAPL one-session price return at most -10%; show 1, 5 and 20 trading-session outcomes. An older synthetic Market B chart is not the requested market.
[qSkew test C11b]
@ask_qSkew What happens after this signal? This is an intentionally unreadable test image.

[qSkew fixture P07]
Synthetic context conflict: text identifies Market A, but the image identifies Market B. This inconsistency is intentional.

[qSkew fixture P08]
Synthetic chart pack: chart 1 is Market A; chart 2 is Market B. Jan 5-8, 2026; USD price-only closes. Artificial fixture only.


[qSkew test C10b]
@ask_qSkew Compare both synthetic charts using the same dates and return basis.
[qSkew test C07b]
@ask_qSkew Apply the parent’s synthetic Market A signal to Market B; my attached chart shows the Market B series.

[qSkew test C07a]
@ask_qSkew Compare the synthetic Market A chart above with my Market B chart over their common dates.
[qSkew test C06b]
@ask_qSkew Use the parent’s synthetic rule, but test the dates shown in my chart.

[qSkew test C06a]
@ask_qSkew Does my attached synthetic chart match the parent’s daily-loss definition?

[qSkew test C05b]
@ask_qSkew Compare the attached synthetic Market A rule with Market B. Market B closes: 200,190,209,209 on the same dates.

