

Baseball Operations & Analytics · Player Development · Built PACU Baseball Performance · Former Analytics Intern @nwbbstats
Rancho Santa Margarita, CA
Joined November 2026
- Tweets38
- Following365
- Followers175
- Likes12




Pinned Tweet
I'm Trevor, a college baseball player at Pacific University building tools that turn player-development data into something players and coaches actually use.
Here's what I've been working on 🧵
Is there really an ideal batting order? Last spring we played 11 one-run games and lost six. So I tested every possible order of our 2026 Pacific lineup.
All 362,880 of them. 🧵
So when should you change it? Lineup protection mostly doesn't hold up. The hot hand is real, but teams overreact to a few at-bats. Move a hot hitter up for a series. Don't shuffle after every 0-for-4.
1
907
What the numbers point to:
1. Get the right nine on the field first.
2. Best three hitters at 1, 2 and 4.
3. Weakest three at 7–9.
4. Change it for real reasons, not one game.
Full write-up: docs.google.com/document/d/1…

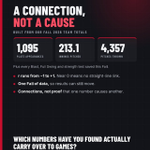
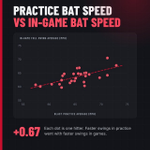
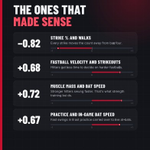
After a full fall of tracking testing, practice and game data for our team, I looked at which numbers actually moved with game results.
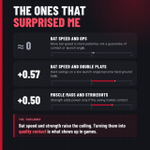
Some made obvious sense. A few surprised me. 🧵

Two more that surprised me:
• Bat speed and double plays: r = +0.57. Hard swings on a low launch angle become hard ground balls, and hard ground balls become two outs.
• Muscle mass and strikeouts: r = +0.50. Strength only adds power if the swing makes contact.
1
109

Should D3 teams play small ball or swing away? I parsed every NWC game from 2023–26 (903 games, 73,669 PAs) and built our league's own run expectancy table. Here's what our run environment actually rewards. 🧵
Parks matter. Conference games at Whitworth produce 33% more runs than Whitworth's road games (park factor 133). Linfield (83) and PLU (89) are the hardest places to score.

1
1,054
Bottom line: in our league, outs are expensive, and baserunners are gold. The numbers say swing, take your walks, run selectively, and save the bunt for a runner on 2nd late. Full write-up: docs.google.com/document/d/1…
