

Enhance your investments and trading strategy with our indicators. Optimize your Entry Points. Extend your Take Profits. Minimize your Stop Loss.
Wyoming, USA
Joined December 2020
- Tweets13.7K
- Following411
- Followers10.8K
- Likes3.1K




Pinned Tweet
Bitcoin
You may have heard us say that the crypto market "lacks liquidity." 80% of the time, the price is manipulated to liquidate positions. We explain why this happens, the battle between bots, and how this affects your trading.

Trading Different retweeted

bitcoin:native | ¿Cuál se salva y cuál es cazada? 🐋 Capítulo 2
El 10/11 te mostramos tres ballenas en el mapa de Hyperliquid. Hoy BTC bajó hasta 71.227, y ya tenemos la respuesta:
🔴 Ballena 1 · CORTO 40x
SE SALVÓ Y REDOBLÓ. Volvió a entrar en corto cerca del mínimo, en 71.697. Su liquidación está en 72.495, a menos de USD 1.000 del precio.
🟢 Ballena 2 · LARGO 40x
SE SALVÓ POR ≈ USD 100. Vendió 4 veces en plena caída y perdió ≈ USD 972K. Su liquidación quedó en 71.125.
🟢 Ballena 3 · LARGO 12x
SE RINDIÓ. Cerró todo 1,5 horas antes del mínimo: −USD 10,8M en un solo minuto, entre BTC y ETH.
🔵 Ballena 4 · LARGO 20x · NUEVA
USD 25,5M desde 74.424. Su liquidación está en 70.595.
Ninguna fue cazada todavía, pero ninguna quedó bien.
Abajo, el pool de largos a 50x (71.181 → 70.365) tiene adentro las liquidaciones de las ballenas 2 y 4. Arriba, el pool de cortos (72.400 → 72.600) tiene la de la ballena 1. El precio está en el medio.
Solo comunicamos DATOS… el análisis e interpretación es 100% tuyo.
Lo viste aquí, en La Ruta del Precio.
Trading Different retweeted
📍 bitcoin:native empieza a tocar los 70.000… y abajo está lo más caliente del bloque
Mapa de 5 minutos, con todos los apalancamientos (10x a 100x):
🔻 BTC siguió bajando dentro del bloque de largos y barrió la línea de 70.573 que marcamos esta tarde.
🎯 El mínimo quedó en 70.300 y ahora cotiza en 70.390.
🔻 Lo que queda abajo:
🔥 Una línea muy cargada justo debajo de los 70.000, cerca de 69.950.
🟠 El bloque sigue denso hasta 69.600.
🟢 Más abajo, una capa más liviana que llega a 68.600.
🔺 Arriba, el mapa está casi vacío: no hay bloques de cortos relevantes hasta los 72.000.
El precio ya entró en la parte más caliente del bloque. Los 70.000 son el siguiente imán.
El mapa no indica la dirección del precio. Muestra dónde están las posiciones apalancadas que serían liquidadas si el precio llega a esos niveles.

BTC on #Hyperliquid 15 min chart 📊
Bitcoin keeps drifting lower in an orderly way, with small bounces that run out of steam quickly and fail to change direction. ⚖️📉
To the downside, $70,450 is the next block of liquidity price hasn’t touched yet, and where it points if the decline keeps this pace. 📉🧲
To the upside, $72,500 marks the zone price cut through during the drop; a wider bounce could take it back to look for it. 🎯🚀
See the Liquidation Heatmap here:
👉 tradingdifferent.com/es/dash…
#BTC #Bitcoin #Crypto #LiquidationHeatmap #LiquidityLevels #BitcoinTrading #CryptoMarket #BTCUSD #Trading

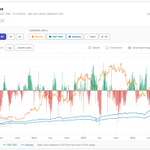
📊 #BTC | Bitcoin and liquidity have parted ways again. Last time, it lasted about six weeks.
Price tells you what happened. Liquidity tells you what’s in the tank.
Net liquidity vs. BTC price, weekly, last 12 months:
💧 Net liquidity rebounded to $5.81T as of Nov 4, up from about $5.72T in late October.
🟠 Bitcoin went the other way and is at $71,742 today.
We’ve seen this divergence before:
📅 In June–July, liquidity climbed to its yearly peak near $6.0T while BTC printed its low near $60K.
📈 In August, BTC caught up and jumped to the $80K area.
Nothing guarantees the same outcome this time. Divergences can close in either direction, and history doesn’t repeat on schedule.
But when price and liquidity disagree, at least one of them is wrong about something. That’s worth watching.

💡 The Net Liquidity chart is free at Trading Different. Create your account, no card needed, and compare it with BTC yourself.
👉 tradingdifferent.com/es/dash…
📊 #BTC | This drop wasn’t only leverage. Spot showed up too.
Most drops in recent weeks were leveraged flushes. This one looks different.
All exchanges, 1h:
🔻 BTC fell from about $74.7K to a low of $71,218, and is now at $71,703.
💥 Long liquidations spiked, the largest since Monday’s flush.
📉 Open interest fell to $37.11B, its lowest level in two weeks: $38.09B on Monday, $37.79B yesterday.
🟡 Coinbase spot volume hit its biggest hour since Nov 5, roughly $140–150M.
Leverage keeps leaving the market while spot volume rises. Real money traded this move, not just forced exits.
Less leverage means less fuel for violent moves. But the largest long block on the map still sits just below price.

If you already trade seriously, choose your plan at Trading Different. No auto-renewal.
👉 tradingdifferent.com/es/dash…
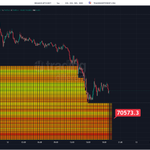
📊 $BTC | is sitting on top of the biggest long block on the map, and it has already started eating into it.
Most traders see a calm candle. The map shows a wall of leveraged longs right underneath.
5-minute map, all leverage from 10x to 100x:
🔻 BTC fell from $74,771 and dropped straight into the long block that started at $72.7K.
🧹 It swept the top part of that block, down to a low of $71,218.
↗️ It bounced and is now at $71,693.
What’s still below:
🔥 The hottest line is at $70,573, just 1.6% from price.
🟠 The block keeps going down to around $69.8K, with another heavy line near $69.9K.
🔺 Above, the map is thin all the way back to $74.7K.
Price has walked straight into the zone where most leveraged longs sit. Each tick lower brings more forced exits into play.

If you already trade seriously, choose your plan at Trading Different. No auto-renewal.
👉 tradingdifferent.com/es/dash…
Trading Different retweeted
bitcoin:native | Análisis de lo macro a lo fino
El precio sigue retrocediendo, cazando la liquidez de los largos apalancados. No es novedad para la comunidad rutera: ya conocían las zonas.
1 · Ciclo: 71.887, −43 % desde el máximo, a 402 días del techo.
2 · Oferta: la emisión anual es de 0,82 %. La caída no la explica la oferta: la explica la demanda.
3 · Liquidez: la Liquidez Neta está alta (5,81 billones USD), pero el impulso es negativo (−0,38 σ).
4 · Institucional: los ETF tienen ≈100.000 BTC menos que en su pico. El 11/11 salieron 4.050 BTC.
5 · Costo de producción: 56.409 (BTC Supplier Model).
6 · Estado Bitcoin: después de varias compilaciones en neutro bajista, hoy el informe da NEUTRO. A la ventana del PBW le quedan 4 días.
7 · Largo plazo: cuatro herramientas apuntan a la franja de 53.000 a 58.000.
8 · Corto plazo: tres mapas apuntan a los 70.000. Lo grueso del pool sigue entre 71.168 y 69.115.
Solo comunicamos DATOS… el análisis e interpretación es 100% tuyo.
Lo viste aquí, en La Ruta del Precio.
Herramientas como Liquidation Heatmap y High Frequency permiten anticipar áreas clave, otorgándole al trader una ventaja real al momento de proyectar movimientos y operar con mayor precisión. #Bitcoin Ejemplo:
tradingdifferent.com/es/dash…


Trading Different retweeted

bitcoin:native - 72's and the trendline hit. Trimming some from these intra-week trades


Trading Different retweeted

En la segunda mitad del año...
La correlación entre #Bitcoin y el #SP500 viene siendo de un 38%, bastante significativa como para hacerle seguimiento.
Sin embargo en la última semana se empezó a evidenciar una "descorrelación" donde el SP está recuperando valor luego de una gran caída, y bitcoin continúa marcando niveles mas bajos.
Podríamos estar frente a la antesala de un rebote importante para #btc luego de liquidar las últimas posiciones en long.

Trading Different retweeted

🚨 ¡ATENTOS! CAE EL ORO $XAUUSD 📉
¿Hasta dónde puede continuar la caída?
🔴 ¡ENTRÁ YA! Lo analizamos EN VIVO.
youtube.com/live/cWmf83u5qwA

Trading Different retweeted
PANORAMA | bitcoin:native + 5 criptos
Con los mapas de liquidaciones de Trading Different, recién sacados (1h · 10x 25x 50x 100x):
bitcoin:native · 74.498
Rebotó, pero abajo el pool de largos sigue cargado: 72.644 → 69.469. Arriba, no hay un pool cercano.
$ETH · 2.088
Liquidez de los dos lados: cortos en 2.255 / 2.300 y largos en 1.850 / 1.813.
$ADA · 0,1789
Largos justo debajo del mínimo, desde 0,169413. Bloque grande cerca de 0,149.
$HYPE · 73,97
Cortos en 80,381 y largos en 70,041.
$BNB · 688
Rebotó desde 670,23. El pool de largos arranca justo debajo, en 669,64.
$PEPE (1000PEPE) · 0,0049
Cortos en 0,0056195 y largos en 0,0045221.
¿Qué se repite? BTC, ADA y BNB rebotaron, pero el pool de largos sigue justo debajo de su mínimo. ETH, HYPE y PEPE tienen liquidez de los dos lados.
Solo comunicamos DATOS… el análisis e interpretación es 100% tuyo.
Lo viste aquí, en La Ruta del Precio.
El backtesting es fundamental en el desarrollo de una estrategia de trading sólida.
La herramienta #Backtest te permite elegir días específicos para estudiar el comportamiento del precio, identificar patrones recurrentes y evaluar el rendimiento de tus estrategias antes de aplicarlas en tiempo real. #Bitcoin
tradingdifferent.com/es/dash…

La liquidez continúa siendo uno de los principales factores que condicionan los movimientos de #Bitcoin. A través de Liquidation Heatmap es posible identificar las zonas donde se concentra una mayor cantidad de posiciones apalancadas y evaluar su potencial, a la hora de atraer al precio.
Por otro lado, High Frecuency grafica la actividad de bots que ejecutan cientos de trades por segundo para manipular el precio.
Ejemplo:
tradingdifferent.com/es/dash…

📊 #BTC | Wall Street keeps selling Bitcoin, for the fourth day in a row.
Most traders watch the price. Few check who is actually selling.
Spot BTC ETF flows on Nov 10:
🔴 IBIT: −1,038 BTC
🔴 FBTC: −488 BTC
🟢 MSBT: +265 BTC, the only fund buying
📉 Daily total: −1,261 BTC
That makes four straight sessions of net outflows (Nov 5, 6, 9 and 10). Last week alone, ETFs sold a net 16,838 BTC.
Even so, the outflows are shrinking: −5,431 BTC on Nov 6, about −2,900 on Nov 9, and −1,261 yesterday. The pressure is still there, but it’s getting smaller.
Price shows you the result. ETF flows show you who is behind it.

💡 The ETF flow tracker is free at Trading Different. Create your account, no card needed, and follow it day by day.
👉 tradingdifferent.com/dashboa…