jj (@Jamal___James) profile picture

https://nitter.cf/t.co/8YVbX0M5hQ on bluesky

Tempe, AZ
Joined November 2017
Photo by jj (@Jamal___James)Photo by jj (@Jamal___James)Photo by jj (@Jamal___James)Photo by jj (@Jamal___James)Photo by jj (@Jamal___James)Photo by jj (@Jamal___James)Photo by jj (@Jamal___James)Photo by jj (@Jamal___James)Photo by jj (@Jamal___James)Photo by jj (@Jamal___James)
Was Hobbs that good, or Biggs that bad? Hobbs outperformed the Democratic Senate candidate in every Arizona LD with a regular D–R matchup. A few came close. Here are the 10 that came closest to her two-party vote share.
6
2
2
30
2,957
And here are the ten Senate races where the Democratic candidate ran furthest behind Hobbs in two-party vote share.
6
386
LDS population is only at the county level, but here I used the number of LDS stakes per LD. Those 5 east valley districts (7,9,10,14,15) did not have the biggest shifts.
Replying to @ryanburge
seeing this by Legislative District in AZ would be fascinating. Dems won in heavily LDS districts that were like +18 Trump
1
1
8
951
The big shifts came in heavily Hispanic districts.
3
1
9
1,032
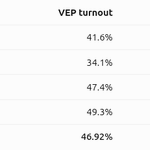
Arizona midterms turnout by voting eligible population (from U Florida Election Lab) and by registration (AZ SOS).
1
4
1
15
4,648
Turnout percent in Maricopa County was down in 2026 compared to the last two midterms.
2
1
8
1,676
Which AI is running the @azcentral social media accounts?
This quoted post is unavailable.
1
3
218
For @raghuAZPoliMaps . That drop of 7682 ballots leaves a max of 6,529 ballots left to count, but probably about 6k.
1
1
5
1,273
Let me help you out with a chart assuming 38/33/29 R/D/I split and a 15% R crossover and 5% D crossover.
Something smells off, the results of this election show major interference. In Maricopa 85 to 90 percent of independents had to have voted for Democrats for the results we got. Not probable. @Bannons_WarRoom
9
8
1
32
5,458
I just noticed this. The LD 17 specifically created by the redistricting commission to "ensure that right-of-center communities in the broader Tucson area are able to elect a leader to represent them in the Tucson area."
5
9
1
75
15,645
In AZ LD14, Walsh (D) leads Biggs (R) by 2,544 votes, with an estimated 14,000 ballots remaining. My precinct-level projection, assuming remaining ballots follow each precinct's existing voting percentages, suggests Walsh's margin would grow by several hundred votes.
1
1
25
1,454
In CD1 there are about 27k ballots outstanding and the vote gap is 22,494. Why the heck hasn't the AP, NYT, etc called this for Shah already?
4
2
24
1,881
I know very closely the uncounted number of ballots in each precinct. Fixing the current D and R percentages in CD-1. Based on this Shah increases his vote percentage slightly.
4
3
25
5,265
Using the same method of fixing percentages for each precinct in AZ CD 8.
3
1
3
831
I can only project CD-5 for Maricopa County, which is about 80% of the district. No idea how many votes in Pinal. Lamb is ahead and the Maricopa portion is not projected to change much.
1
358
This map looks like it is essentially all of the outstanding ballots.
A map of uncounted ballots dropped off on election day in Maricopa County
1
2
8
1,360
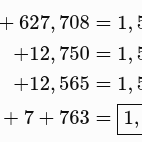
The noon drop of MariCo ballots "in hand" added only another 13,278. That brings the uncounted ballots dropped on election day to 206,618. The small number of newly scanned ballots leads me to think this is nearly all late earlies.
4
1
8
1,748
these 13k late earlies by CD
1
2
824
A map of uncounted ballots dropped off on election day in Maricopa County
4
5
3
24
18,660