

Love my family and friends. I am an entrepreneur - Mortgage Banking; HMDA. Born and raised in Bulgaria. Working, living in the US. Painting as a pastime.
- Tweets96
- Following225
- Followers53
- Likes77







ALT This image features a presentation slide from mortgagedata.ai titled "Building a VA Plan." It highlights five sources for a VA plan: Census, County Recorders, Listings, HMDA, and Ginnie Mae. The slide mentions data for Travis County, TX, with specifics on veteran populations, lending growth, and rates. The design includes charts and graphs illustrating data insights.

ALT Chart titled "What AI is allowed to do decides its risk tier" with categories: Critical, High, Moderate, Low. Critical: Real-time credit decisioning. High: AI-assisted underwriting. Moderate: Market research and analysis. Low: Internal productivity tools. Note at bottom: "Underneath all of it is the data." Source: OCC Super Intelligence Framework, Nov 4, 2026. Examples: Polygon Research. Branding: mortgagedata.ai.

ALT Map of the United States showing USDA purchase lending changes from January to July 2026, compared to 2025, by loan count. States are color-coded: blue for up more than 10%, light blue for up 0-10%, light brown for down 0-10%, medium brown for down 10-25%, and dark brown for down more than 25%. Alabama shows an increase of 21%, while Wisconsin shows a decrease of 21%.

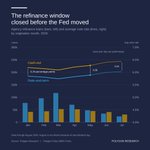
ALT Bar and line chart titled "The refinance window closed before the Fed moved," shows agency refinance loans from January to July, with projections to 2026. Loans are on the left axis and average note rate on the right. A "Cash-out" line in yellow, marked with data points, starts at about 6.4% and ends around 6.7%. A "Rate-and-term" line in blue starts at 5.5% and ends slightly lower. Data from Polygon Research.

ALT Map of the United States showing current AI use by state. States are shaded in different shades of blue to indicate AI usage estimates, ranging from 0% to 28%. Notable higher estimates include Texas, California, and Florida. Data sourced from BTOS.

ALT Chart showing HOEPA loan originations from 2018 to 2025. The line graph indicates the count, while bars represent the loan volume in billions of dollars. Key data points include peaks in 2023 and 2025, with a notable loan count and volume increase. Source: Polygon Research.


ALT Chart - increase in average purchase loan amounts from 2018 to 2026, $233,409 in 2018 and $360,320 in 2026 YTD. The line graph displays consistent growth with notable points in 2021 at $322,071. Source: Polygon Research - Polygon Pulse (MBS Pivot).

ALT The image is an infographic titled "How big is the multigenerational market?" It presents three sets of data: "Strict" with 5.1M households for 3 or more generations, The footer states data sources: Polygon Research and CensusVision (ACS 1-Year PUMS, 2024)


ALT Graph depicting FHA ARM refinancing data: From 2016 to 2026, a sharp rise is observed. In May 2026, loan endorsements reach 3,461, surpassing the total 2,714 loans of 2017. Data source is Polygon Research - Polygon Pulse (FHA Pivot).

ALT Chart showing top 10 lenders by loan count for FHA ARM refinancing from a conventional loan, year-to-date 2026. The list includes Rocket Mortgage, United Wholesale Mortgage, Freedom Mortgage, New American Funding, PennyMac, Mutual of Omaha, loanDepot, Guaranteed Rate, Sago Home Loans, and NewRez. Loan counts and average loan amounts are displayed for each lender. Rocket Mortgage leads with 1,266 loans and an average loan amount of $323,192.

ALT Chart detailing FHA ARM Streamline Refinances from the top 10 lenders, based on loan count for the year to date 2026. United Wholesale Mortgage leads with 1,902 loans averaging $338,038. Following are Freedom Mortgage with 1,399 loans averaging $209,864, Rocket Mortgage with 1,221 loans averaging $309,306, and PennyMac with 432 loans averaging $348,856. New American Funding, Sun West Mortgage, and loanDepot follow, each with varying counts and averages. The list concludes with Mutual of Omaha, Guaranteed Rate, and NewRez.


ALT Homebuyers using conventional loans with less than 5% down by state, mapped by Polygon Research. Showing concentration in Nebraska, Missouri, Indiana, Michigan, Iowa, Ohio, Kansas.

ALT Polygon Pulse graphic: Competition, Channel, Opportunity — three forces drive mortgage outcomes, one subscription tracks all three. MBS Pivot: agency originations, lender positioning, LLPA heatmaps. FHA Pivot: broker–wholesale relationships by zip code. CPS Pivot: 136M+ households, labor, tenure, first-time buyer sizing. Free trial, monthly updates, no contracts. polygonresearch.com/pricing