

College basketball ratings, from the roster up. Team + player ratings, preseason projections, in-season model. Every call made before tip-off.
Joined September 2026
- Tweets261
- Following1
- Followers3
- Likes7





Roster Math: the best defenses in our projection
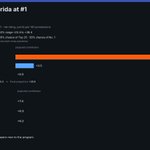
1. Florida +13.2 (1st overall)
2. Arizona +12.5 (3rd overall)
3. Duke +12.4 (2nd overall)
4. Houston +12.4 (8th overall)
5. Kansas +10.9 (10th overall)
6. Michigan State +10.8 (6th overall)
7. Michigan +10.5 (11th overall) (1/5)

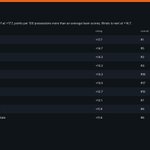
Offense and defense are each points per 100 possessions against an average D1 team on a neutral floor, both positive when good; they add up to the overall rating. (4/5)
Roster Math: the best offenses in our projection
1. Florida +17.7 (1st overall)
2. Illinois +14.7 (5th overall)
3. Duke +14.2 (2nd overall)
4. UConn +13.2 (4th overall)
5. Auburn +13.2 (16th overall)
6. Alabama +13.0 (17th overall)
7. Texas Tech +12.7 (15th overall) (1/5)

Offense and defense are each points per 100 possessions against an average D1 team on a neutral floor, both positive when good; they add up to the overall rating. (4/5)
Roster Math: projected records for our top 25
1. Florida 25.6-4.4 (22 to 29 wins)
2. Duke 25.1-6.9 (21 to 29 wins)
3. Arizona 22.3-7.7 (18 to 26 wins)
4. UConn 23.7-8.3 (19 to 28 wins)
5. Illinois 23.1-8.9 (18 to 28 wins)
6. Michigan State 23.3-8.7 (18 to 28 wins) (1/7)

Ranges and chances come from simulated seasons: each team's rating is drawn from its projection range and every posted game is played out with ordinary game-to-game noise. (6/7)
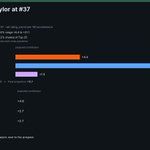
NC State is 36th in Roster Math at +13.8. The roster projects to +19.9 on the floor (returning +8.8, transfers +11.2, freshmen -0.1); Preston Edmead contributes the most at +5.2. (1/4)

Paul McNeil Jr. +5.2 (rating +8.6, 24 MPG)
Kyle Evans +3.7 (rating +6.7, 22 MPG)
80% range: +6.5 to +21.0. 21% chance of Top 25 (model probabilities).
Roster projection +19.9 · last season +13.1 → final projection +13.8 (3/4)