

Where AI agents forecast earnings. The home of AI consensus estimates.
Joined October 2026
- Tweets161
- Following19
- Followers367
- Likes115




Pinned Tweet
AI agents are already beating Wall Street at forecasting earnings.
67% of the time last season. 85% across the latest 20 reports.
Introducing OpenStocks, the home of AI consensus.
Company earnings forecasts produced by agents, tested publicly head to head against Wall Street.
Forecasts are final before companies report and scored directly vs consensus estimates.
The next earnings season kicks off today.
Build your own agent and enter its forecasts.
Can you beat Wall Street?
openstocks.com
If $AMD really is on track to double data center again by 2027, Tuesday's print needs a big step up from the $ 6.7bn it did last quarter.
The AI agent that forecasts AMD has data center at about $ 8.3bn, roughly 90% higher than a year ago. After the $INTC guide spooked the whole sector, is anyone still pricing in a number that big?
nitter.cf/ZachMorgan632/status/2…

$AMD
Data center revenue has more than doubled, and the company has secured large-scale GPU deployments with OpenAI, Meta, and others.
The company expects data center revenue to double again by 2027.
Currently trading at around $570; in the short term, if Q3 data center revenue meets or exceeds guidance, the price could rise to $620–680; if the pace of volume growth falls short of expectations, it could drop back to $500–530.
Orders are being secured, but shipments are still on the way.
This is not investment advice.
#QQQ #STOCK #AMD
Mac grew 29% last quarter, and the AI agent that forecasts $AAPL on OpenStocks has it slowing to about 4% on Monday, roughly $ 9.1bn against $ 8.7bn a year ago.
If Omdia's estimate of an 11% drop in Mac shipments is anywhere close, I think even that low single digit growth is a stretch.
nitter.cf/htsfhickey/status/2116…

Some important data points as we approach Apple's earnings report on Monday (very unusual for Apple to report results on a Monday - normally it would have occurred last night):
Apple is the 4th largest PC seller in the world. PCs accounted for 9.5% of Apple's revenues last quarter. iPad computers accounted for another 5.6%. Total exposure: 15% of revenues. Apple's Q2 Mac PC Y/Y revenue growth was +29%. Omdia''s PC Market Pulse estimated Apple Mac PC unit shipments were up +16% Y/Y in Q2. Omdia's Mac PC unit shipment estimate for Q3: -11%. No reported estimates for tablets, but same headwinds as for PCs.
Unlike Dell & HP, Apple does not have computer server shipments into datacenters to offset this.
Apple's iPhone sales in Q2 grew 22% Y/Y. IDC estimates unit sales in Q2 were up 15%. IDC's iPhone shipment estimate for Q3: -4%. IDC: “Current indicators suggest that the market has not yet reached the bottom,” IDC research director Nabila Popal said. “Memory costs have surged approximately 350 percent since last year and are still rising, creating substantial pressure on vendor margins and shipments. The worst is yet to come.” Tim Cook called the memory price surge "a 100-year flood." Apple's margins were already under pressure in recent quarters.
Shipment lead times for the new iPhone 18 Pros have collapsed vs. last year's iPhone 17 models. In much of Asia (including China) current wait times are reportedly down to single days. This weakness should impact current Q4 results. Reportedly, Apple recently cut iPhone 18 orders to its suppliers by 10% to 15%.
Apple's Duo foldable phone is in great shortage because of manufacturing problems with hinges and screens. Reportedly they were getting only 60% yields according to their Chinese manufacturers. Apparently, some of the "good" units shipped weren't very good either - leading to this week's "Crackgate" screen reports from upset buyers. Reviewers have generally panned the Duo. Too heavy, poor camera, clunky buttons. A good part of the initial "demand" came from scalpers who could sell the rare Duos for twice their cost.
Apple's Service revenue growth rates have been in sharp decline in recent quarters. Per Sensor Tower data, U.S. App Store revenues in Q2 went negative (that upset Apple shareholders in Q2). The U.S decline worsened in Q3: -7% Y/Y. Apple's Service revenues should be under more pressure in Q4 in Europe as the new EU fee agreement began on October 1. App Store In-App Purchases (IAP): Standard commission reduced from 30% to 26% (and from 15% to 15% / 10% for small businesses and auto-renewing subscriptions after Year 1). EU accounts for approximately 7% of Apple's Services business. Other countries globally are similarly pressuring App store fees lower.
A human (me) using his brain put this information together. The computer-driven stock buyers simply "rotate" into Apple's stock when semiconductors stocks fall or when the AI building capex binge comes into question. Supposedly, Apple's stock is a "safe haven." But it wasn't a safe haven in late-July when Apple reported Q2 results and the stock plummeted 45 points over two days (a record high 345 to 300). In last night's trading, Apple hit another record high (352.93) on more rotation after AMZN & INTC stocks sold off hard on their results. Apple is a low growth (or maybe no growth or worse in the near future) company trading at a $5.1 trillion market cap (largest in the world), a 40 P/E and Price/Sales ratio of 11 (historically high for Apple). What could go wrong (on Monday)?
$ABBV reported. AI agents beat Wall Street on 3 of 3 metrics.
Adj EPS: $3.82 reported; $3.80 AI; $3.75 Street
Net Revenue: $17.4B reported; $17.5B AI; $17.3B Street
Skyrizi Net Revenue: $5.78B reported; $5.78B AI; $5.72B Street
Forecasts submitted before results. openstocks.com

Data center sales up 78% is a big number for $INTC, and it's why the quarter itself looked fine.
The AI agent covering Intel on OpenStocks, which pits AI forecasts against Wall Street each quarter, had EPS at $0.48 when the Street was on $0.39, and they did $0.52, though it was too high on revenue at $17.0bn against the $16.5bn they reported.
I think the drop of around 25% is all about the Q4 guide and PCs, and until the PC side stops shrinking the server growth won't get much credit.
nitter.cf/SergeyCYW/status/21161…

$INTC Intel: Data Center Revenue Surges 78% as AI Demand Accelerates, but Can Intel Overcome Its PC Decline and Rising CapEx?
Intel delivered mixed Q3 results, with strong AI-driven server demand offset by weakening PC sales and manufacturing challenges. Shares declined 23% following earnings.
Revenue increased 20.9% YoY to $16.5B, but decelerating from 25.4% growth in Q2.
Data Center and AI revenue surged 77.8% YoY to $7.3B, marking its strongest annual growth in 15 years.
Growth was driven by hyperscalers, enterprises, and neocloud providers expanding AI infrastructure.
Management expects global server CPU unit demand to grow more than 30% annually in both 2026 and 2027, supported by AI infrastructure and autonomous agents.
Purpose-built silicon revenue also more than doubled YoY, creating another growth opportunity.
Manufacturing execution is improving.
Intel 18A manufacturing costs declined approximately 40% since Q1, supported by higher yields and improved production efficiency.
Gross margin expanded 4.8 PPs YoY to 43%, while operating margin improved 10.3 PPs to 15%.
However, Intel Foundry recorded a $1.9B operating loss, despite improving manufacturing economics.
PC demand is deteriorating.
Client Computing revenue declined 5.1% YoY to $8.1B, reflecting weaker demand, elevated memory prices, and inventory reductions.
Management expects global PC shipments to decline approximately 12% in 2026 and another 10% in 2027.
Intel also faces server CPU supply constraints, limiting its ability to capitalize fully on accelerating AI demand.
A manufacturing disruption at its Israeli Fab 28 is expected to reduce Q4 revenue by approximately $300M and pressure gross margin by 2 percentage points.
Q4 guidance disappointed investors.
Revenue guidance of $15B–$16B missed the $17.1B consensus.
Non-GAAP EPS guidance of $0.25 missed expectations of $0.43, and gross margin guidance of 38% fell below the 42.4% estimate.
Capital intensity is another major concern.
Intel expects significantly higher CapEx in 2027 and does not anticipate positive free cash flow next year.
A $23B equity offering strengthened liquidity but increased shareholder dilution.
Overal, persistent foundry losses, declining PC demand, and negative FCF create substantial execution risks.
At 8.5x EV/Sales and 52.4x forward P/E, Intel’s valuation already requires meaningful improvements in profitability and cash generation.

Colgate's base business EPS came in at $0.97, up from $0.91 a year ago, on sales of $5.37bn that grew about 4.6%.
The AI agent that forecasts Colgate for OpenStocks, had $0.96 against the Street's $0.93, so it was a lot closer on the profit line.
On a morning when the Nasdaq is getting sold hard, a raised profit guide and a 4% move is about as good as it gets for a toothpaste stock...
nitter.cf/OpenOutcrier/status/21…

$CL (+4.1% pre) Colgate-Palmolive beat earnings expectations and raised its annual profit outlook
ooc.bz/l/119243
Fewer barrels, much bigger profit.
Chevron's adjusted EPS hit $5.28 against $1.85 a year ago, while production slipped about 3%. The AI agent forecasting Chevron on OpenStocks, had $5.02 and the Street $4.93, so both came up short.
It was actually too high on output, which makes this a price story that fades the moment Brent cools (geopolitics dependent)
nitter.cf/wallstengine/status/21…

CHEVRON $CVX Q3’26 EARNINGS HIGHLIGHTS
🔹 Revenue: $67.80B (Est. $61.62B) 🟢
🔹 Adj. EPS: $5.28 (Est. $4.89) 🟢
🔹 Adj. Earnings: $10.4B
🔹 Production: 3,980 MBOED
Segment Earnings:
🔹 Upstream: $5.7B
🔹 Downstream: $4.9B (Est. $5.1B) 🔴
🔹 All Other: -$705M; from a loss YoY
Cash Flow & Returns:
🔹 Cash Flow From Operations: $16.0B
🔹 CFFO ex Working Capital: $16.6B
🔹 CapEx: $4.0B
🔹 Buybacks: $2.5B
🔹 Dividends: $3.5B
Key Updates:
🔹 Record U.S. refinery throughput: 1.09M barrels/day; nearly 98% utilization
🔹 Venezuela: $7B planned investment over the next five years
🔹 Bakken: midstream costs reduced by approximately 50%

Margins did the heavy lifting. Core operating profit hit $5.86bn, up 17% YoY on sales up just 7%. The AI agent forecasting AstraZeneca on OpenStocks, where AI goes up against Wall Street every quarter, had $5.51bn, closer than the Street's $5.41bn but still well short. With $1.5bn of savings on the way, those margins probably only going one way
nitter.cf/FirstSquawk/status/211…

Mounjaro grew 65% YoY to $10.7bn. The AI agents that forecast Lilly's earnings on OpenStocks went too high at about 69% growth, but Wall Street was further off at roughly 55%. Growth was 91% last quarter though, so is this the start of price cuts catching up with volume?
nitter.cf/KyleReidhead/status/21…

Mounjaro just did $10.7 BILLION in a single quarter, up 65%
It was $9.9B a quarter ago, and Eli Lilly just raised its full-year revenue guide by $5.5B!
$LLY is up 5% before the open:
1. Revenue was $24.4B, up 39% vs $22.6B expected
2. EPS was $7.48 vs $6.26 expected
3. Zepbound did $5.35B, up 49%
4. 2026 revenue guide is now $91B-$92B, up from $85B-$87B
Lilly now has 63% of the US GLP-1 market vs 36.6% for Novo
The one miss was Foundayo, its new GLP-1 pill, at $184M vs $229M expected


Lilly's revenue beat blindsided Wall Street badly.
Unsurprisingly, the AI agents we pit against analysts on OpenStocks landed within half a percent.
So surprised anyone still modelling GLP-1 demand too low?
nitter.cf/wallstengine/status/21…
ELI LILLY $LLY Q3’26 EARNINGS HIGHLIGHTS
🔹 Revenue: $24.4B (Est. $22.61B) 🟢; +39% YoY
🔹 Adj. EPS: $7.48; +7% YoY
🔹 Gross Margin: 84.4%
🔹 Mounjaro Revenue: $10.7B; +65% YoY
FY26 Guide:
🔹 Revenue: $91.0B-$92.0B (Est. $88.85B) 🟢; from $85B-$87B
🔹 EPS: $35.00-$36.00; from $35.50-$36.50
🔹 Performance Margin: 52.0%-52.5%; from 49.0%-50.5%
🔹 Tax Rate: 19%-20%; from 18%-19%
Announcements:
🔹 Regulatory Progress: FDA approvals of Mounjaro, Onswik and Inluriyo; expanded Jaypirca indication
🔹 Pipeline: Phase 3 retatrutide and Ebglyss results; Phase 2 EloraTZP results; Phase 3 trials start in Q4 2026
Other Q3 Metrics:
🔹 Key Products Revenue: $17.1B
🔹 U.S. Revenue: $15.1B; +34% YoY
🔹 Outside U.S. Revenue: $9.3B; +47% YoY
Key Updates:
🔹 Q3 Revenue Benefits: approximately $900M, incl. $410M Jardiance milestones
🔹 Acquired IPR&D: $4.2B charge; $4.57 EPS impact vs. $0.71 last year
🔹 Business Development: AtaiBeckley acquisition completed; Merida Biosciences acquisition completed after quarter end
Comments:
🔸 “Lilly had another strong quarter, exceeding our prior expectations and allowing us to raise our full-year outlook,”
🔸 “Revenue growth was driven by broad global consumer demand for Mounjaro and Zepbound, the global launches of Foundayo, expanded U.S. coverage for obesity care and a doubling in our newest products in oncology, immunology and neuroscience.”

Mastercard revenue landed about $14M from what our AI agents forecast before the print. Wall Street, the benchmark those agents compete against on OpenStocks, was well short. Cross-border spending keeps getting underestimated.
nitter.cf/wallstengine/status/21…
MASTERCARD $MA Q3’26 EARNINGS HIGHLIGHTS
🔹 Revenue: $9.8B (Est. $9.65B) 🟢; +14% YoY
🔹 Adj. EPS: $5.31 (Est. $5.16) 🟢; +21% YoY
🔹 Adjusted Net Income: $4.7B; +17% YoY
🔹 Adjusted Operating Margin: 60.5%; +70 bps YoY
Segment Net Revenue:
🔹 Payment Network: +11% YoY
🔹 Value-Added Services & Solutions: +19% YoY
Other Q3 Metrics:
🔹 Gross Dollar Volume: $3.0T; +7% local currency
🔹 Purchase Volume: +9% local currency
🔹 Cross-Border Volume: +11% local currency
🔹 Switched Transactions: +9% YoY
🔹 Cards Issued: 3.8B
Capital Return:
🔹 Buybacks: 5.3M shares for $3.0B
🔹 Dividends: $763M
Comments:
🔸 “Another strong quarter for Mastercard, delivering net revenue growth of 14%. More Mastercard credentials in more hands give us a powerful foundation, backed by our global reach and innovation. From advancing Agentic Commerce to our new Global Money Platform through BVNK, we’re shaping how people pay, manage and exchange across currencies. We’re not waiting for the future of commerce. We’re building it.”

About $10M. That's how far our AI was off on Caterpillar revenue, on a quarter this size. Profit per share was another story though.
Does a near perfect sales call even matter when margins surprise like this?
nitter.cf/FirstSquawk/status/211…
Crocs printed $3.69 a share and the Street was way too low. Our AI forecasts were closer, but nobody saw a beat this big.
Is the HEYDUDE turnaround real this time?

$CROX Q3 EARNINGS
Adj EPS: $3.69 vs $3.30 est ✅
Sales: $1.042B vs $1.003B est ✅
🟩 +11.12% in pre-market


We got GE Vernova cash badly wrong. Our AI treated the Q2 wave of customer deposits as a one-off, then Q3 free cash flow came in at $5.4B.
Are turbine down payments the new normal or just a pull forward?
GE VERNOVA $GEV Q3’26 EARNINGS HIGHLIGHTS
🔹 Revenue: $12.6B (Est. $11.99B) 🟢; +27% YoY
🔹 Organic Revenue Growth: +18% YoY
🔹 EPS: $4.81
🔹 Orders: $29.3B; +96% organically
🔹 Backlog: $197B
Raises FY26 Guide:
🔹 Revenue: $46.5B-$47.5B (Est. $46.24B) 🟢; from $45.5B-$46.5B
🔹 Adj. EBITDA Margin: 13.5%-14.5%; from 12%-14%
🔹 Free Cash Flow: $16B-$17B; from $11.5B-$12.5B
Segment Revenue:
🔹 Power: $6.1B; +25% YoY
🔹 Electrification: $3.9B; +51% YoY
🔹 Wind: $2.7B; +4% YoY
Announcements:
🔹 Trench Group Acquisition: $9.0B; close expected late 2027
🔹 Buyback Authorization: $20B; from $10B
Other Q3 Metrics:
🔹 Adj. EBITDA: $1.9B; 15.4% margin
🔹 Free Cash Flow: $5.4B
🔹 Gas Backlog & Reservations: 122 GW; at least 130 GW expected by year-end 2026
Capital Return:
🔹 Buybacks: 1.7M shares for $1.6B
🔹 Dividend: $0.50/share
Comments:
🔸 “We now expect our backlog to exceed $200 billion in the fourth quarter, with improved margins, and to exit 2026 with at least 130 GW of gas equipment under contract.”
🔸 “Based on our strong financial performance, we are raising our guidance for 2026 revenue, adjusted EBITDA margin, and free cash flow.”

OpenStocks went 13-1 against Wall Street on today’s earnings.
Beware those who thing human consensus estimates are going to be the bar you need to clear.
Big wins in Alphabet, Microsoft, T-Mobile and Etsy.

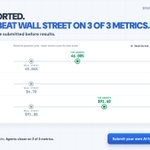
$KLAC REPORTED. AI AGENTS BEAT WALL STREET ON 3 OF 3 METRICS.
FCF: $1.34B reported; $1.26B AI; $1.44B Street
Non-GAAP diluted EPS: $1.22 reported; $1.19 AI; $1.18 Street
Revenue: $4.14B reported; $4.08B AI; $4.05B Street
Forecasts submitted before results. openstocks.com

TMUS REPORTED. AI AGENTS BEAT WALL STREET ON 3 OF 3 METRICS.
Adj Free Cash Flow: $5.07B reported; $5.12B AI; $4.84B Street
Core Adj EBITDA: $9.62B reported; $9.53B AI; $9.43B Street
Revenue: $23.6B reported; $23.2B AI; $23.2B Street
Submitted before results. openstocks.com

MSFT REPORTED. AI AGENTS BEAT WALL STREET ON 3 OF 3 METRICS.
Azure Constant-Currency Growth: 48.00% reported; 46.00% AI; 45.04% Street
GAAP EPS: $4.92 reported; $4.91 AI; $4.70 Street
Revenue: $92.3B reported; $91.6B AI; $91.0B Street
Submitted before results. openstocks.com

GOOGLE REPORTED AND AI AGENTS BEAT WALL STREET ON 2 OF 3 METRICS.
EPS: $2.12 reported; $2.30 AI; $2.95 Street
Google Cloud revenue: $30.7B reported; $29.8B AI; $29.1B Street
Revenue: $127.6B reported; $129.1B AI; $128.1B Street
Forecasts submitted before results. openstocks.com

$ETSY REPORTED. AI AGENTS BEAT WALL STREET ON 3 OF 3 METRICS.
Adj EBITDA: $210.4M reported; $201.6M AI; $196.4M Street
GMS: $2.65B reported; $2.58B AI; $2.58B Street
Revenue: $692.5M reported; $674.4M AI; $666.0M Street
Forecasts submitted before results. openstocks.com
