

CRO @Alphractal | PhD in Physics. Ultracold atoms. Interests: condensed matter, epistemology, quantitative finance, economic cycles and crypto markets.
Joined October 2015
- Tweets577
- Following165
- Followers680
- Likes1.7K





Arch Physicist retweeted

Wild.
US and China’s combined money supply is surging almost as fast as it did during the Covid stimulus madness.
That is a 10% increase in just 12 months!
Let that sink in.
tavicosta.substack.com/p/par…

Arch Physicist retweeted

Pra quem está perdido ultimamente com tanta notícia de IA:
Eu disse isso mil vezes nos últimos 10 anos: programador bem preparado não vai ser substituido. Disse claramente "EU" nunca vou ser.
akitaonrails.com/2026/02/08/…
Quem vai? Todos que eu disse que seriam: os derivados das porcarias de bootcamps e "cursos" da última bolha. TUDO que foi "ensinado" lá é justamente TUDO que é 100% substituível por LLMs e deveriam ser mesmo. São posições que nem deveriam existir. E depois de 2022 a maioria foi cortado já.
Ao mesmo tempo, todo programador que ainda é resistente a usar LLMs precisa parar com isso e usar. Não há nenhum mérito em fazer a mesma tarefa mundana pela centésima vez. Eu realmente não vejo nenhum valor em escrever um Dockerfile na mão, ou configurar Makefile (eca). Tudo que já deveria ter sido automatizado, agora vai ser, e isso é ótimo. Fazer CRUD não tem valor. Fazer relatório não tem valor. Fazer a mesma UI que todo mundo já fez, não tem valor.
akitaonrails.com/2026/09/22/…
Ao mesmo tempo, entenda, "em breve a IA vai substituir todo programador". Não. Isso já é ficção científica. Também já disse N vezes que estamos já batendo no teto. E quem diz "ain, mas e se ..." não tem a mínima noção de custo e engenharia.
akitaonrails.com/2026/09/28/…
Estamos longe, muito longe de IA geral que substitui todas a profissões, Skynet, bla bla bla. Isso é meramente hype e psyop pra inflar valuation de IPO e conseguir influenciar governos a criar leis anticompetitivas.
akitaonrails.com/2026/09/09/…
E, em vez de "chutar" as coisas, faça como eu: adquira dados de verdade pra se basear:
akitaonrails.com/2026/09/15/…
Se entender o que eu escrevi nos artigos acima, você vai ter um entendimento muito mais amplo e matar todo seu deslumbramento excessivo.
A única coisa que importa é realidade objetiva.


Arch Physicist retweeted
This chart is a good reminder that the mining industry is generating profits on a scale no other sector in the market can even come close to matching.
tavicosta.substack.com/p/a-r…

"Be fearful when others are greedy, and be greedy only when others are fearful." — Warren Buffett
"Buy to the sound of cannons, sell to the sound of trumpets." — Nathan Mayer Rothschild

I’m starting to see old crypto exchanges shutting down their operations.
I’m also seeing many crypto influencers becoming discouraged, losing interest, and shifting their attention to completely different topics.
And, of course, the classic headlines are back again.
Hackers here. Hacks there. Fear everywhere.
I’ve been watching this market for more than 10 years, and the same stories keep repeating themselves.
That is a fractal too.
Market cycles repeat, but so do human emotions.
Fear, frustration, greed, disbelief, and disappointment often drive people to make decisions based on emotions, especially when the market refuses to confirm their biases or exposes mistakes in their analysis.
That is exactly why I keep talking about patience and the importance of trusting metrics with strong historical evidence and reliable backtesting.
During the last bull market, we helped thousands of people navigate the market.
During this bear market, many people have also thanked us for helping them understand what was happening before the narrative became obvious.
So I’ll repeat it again:
Stay confident.
Stay calm.
Be patient.
And most importantly, use good data, especially Onchain analysis.
I truly believe this is one of the most important keys to long term success when you treat crypto as an investment.
I once learned a saying that has stayed with me:
Real opportunities to build wealth often live exactly where fear, desperation, and disbelief are at their highest.
Think about that.
And stay in the Alpha.
I forgot to mention. It's already available on the platform for subscribers.
app.alphractal.com/cryptos/c…


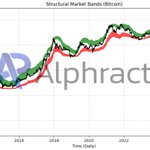
I’ve been working on this metric for some time now. Structural Market Bands uses 100% on-chain data for a model that resembles a physical law more than a statistical model. It’s surprising how blockchain technology enables valuation models with such clearly defined price ranges. I can’t classify these resistance and support levels as “probabilities”; the only concept that fits here is “potential.”
There is one limitation: due to the way it is constructed, it is only valid for UTXO-type blockchains. Even so, it is not suitable for all of them. For example, a significant portion of Zcash’s transactions are private, which prevents this calculation from being accurate. Dash’s mining system complicates the calculation for the support zone, making it very imprecise.
This metric will soon be available on the @Alphractal platform.

You can find pure MVRV here:
app.alphractal.com/cryptos/c…
If you have an Alphractal subscription, you can copy the version with Z-score here:
app.alphractal.com/workbench…
@Alphractal


Dollar Cost Averaging is the simplest disciplined strategy in the market. Periodic capital deployments regardless of price. Diluting cost basis, protecting against volatility.
Benjamin Graham built modern investing on this idea for stocks with solid dividend histories. In crypto, Bitcoin is the only asset with the structural quality that fits the same profile.
But without on-chain data, you're guessing WHEN each purchase lands.
Three Alphractal metrics reveal the mathematically optimal DCA windows 🧵
—
1/ MVRV — Market Value to Realized Value.
A financial oscillator that compares Bitcoin's current nominal price to its historical book value, the exact price at which every circulating coin last moved on the network.
It reveals whether the base of investors is sitting on latent profits or losses.
Optimization uses a 4-year Z-score standardization, expressing how far the current MVRV sits from its own historical mean, in standard deviations.
Z-score below -1 → severe undervaluation → the moment of maximum advantage for DCA execution.
The orange circles on the chart mark every historical instance.

No. It does not use any statistical measures such as mean or standard deviation, let alone regression or Bayesian models. It is derived solely from on-chain data. Basically, it is a mixture of lifespan metrics and market cap.

Arch Physicist retweeted

A Bitcoin structural model built by a PhD atomic physicist just put price inside its support zone.
The Structural Market Bands (SMB) — developed by @arch_physicist , Alphractal's Chief Researcher (PhD Atomic/Molecular Physics) — use coin lifespan reliability data to map the price levels where markets reach exhaustion.
Two zones: structural resistance (top) and structural support (bottom). The deeper price pushes into a zone, the stronger the counter-pressure that pulls it back.
Today's levels:
— Price: $64,526
— Structural Midline: $66,704
— Support Upper Band: $61,367
— Support Lower Band: $55,867
— Resistance Lower Band: $72,042
— Resistance Upper Band: $96,426
BTC is sitting right at the top edge of the support zone, below the midline.
The model's own rule: entering the support zone during a downtrend means the move is being driven by panic and capitulation — and the counter-pressure to correct back inside grows the deeper it goes.
One caveat the model builds in: SMB has to be read with a trend indicator. The support zone means one thing in a downtrend, another in an uptrend. The zone touch is context, not a signal on its own.
What's observable: price is in the lower structural region, resistance sits ~11% up at $72K, deep support sits ~14% down at $55.8K.
Full chart: app.alphractal.com/cryptos/c…

Arch Physicist retweeted
3/ Alphractal developed a proprietary metric that bridges both worlds: Structural Market Bands.
Inspired by the theoretical concepts of support and resistance from traditional TA but calculated entirely by absolute blockchain data.
The metric uses coin lifespan data combined rigorously with short, medium, and long-term market cap movements. Algorithmic processing estimates the price levels where the market reaches its directional exhaustion state.
Two vital trading zones emerge: structural resistance and structural support.
The key difference from classic TA: broken structural bands do NOT reinterpret levels. Support doesn't automatically become resistance. The analytical integrity stays intact through the entire cycle.
Which approach do you use for market structure, traditional support/resistance, on-chain structural, or both? Reply below.

Arch Physicist retweeted
Alphractal is the first platform in the world to ship this structural rebuild of Liquidation Levels.
These are the critical price points where leveraged positions get forcibly closed for insufficient margin. Long positions cluster zones below price. Short positions cluster zones above.
The chart maps every active cluster on BTC right now.
Here's what changed 🧵

Arch Physicist retweeted
The MVRV is widely known as a fundamental oscillator for on-chain profitability analysis.
It calculates the direct ratio between Bitcoin's market cap and realized cap the average acquisition cost of every circulating coin.
— MVRV = 1: financial neutrality.
— MVRV < 1: systemic undervaluation.
— MVRV > 1: overvaluation and latent profitability.
Below 1, the indicator marks every market bottom with precision. The red circles on the chart confirm it.
But the same simple logic fails at market tops. Here's why and the statistical fix 🧵

It's impressive how MVRV continues to be such a powerful metric. All it takes is a little statistical analysis, and the structural bottoms (red) and tops (green)—including the most recent ATH—become visible.
Source: app.alphractal.com/cryptos/c…

I’ve been working on this metric for some time now. Structural Market Bands uses 100% on-chain data for a model that resembles a physical law more than a statistical model. It’s surprising how blockchain technology enables valuation models with such clearly defined price ranges. I can’t classify these resistance and support levels as “probabilities”; the only concept that fits here is “potential.”
There is one limitation: due to the way it is constructed, it is only valid for UTXO-type blockchains. Even so, it is not suitable for all of them. For example, a significant portion of Zcash’s transactions are private, which prevents this calculation from being accurate. Dash’s mining system complicates the calculation for the support zone, making it very imprecise.
This metric will soon be available on the @Alphractal platform.
Arch Physicist retweeted
There is nothing more technically bullish than a 40-year resistance level turning into major support.
That is exactly where gold miners sit today.
Act accordingly.
tavicosta.substack.com/p/a-s…

Bear market is when price is moving from structural top to structural bottom. If there is no panic, this goes from a redistribution plateau to another redistribution plateau. Since October, it has been within the bear market structure. And the real structural capitulation level, only the future can show. Balanced price is just a metric, and I am waiting to see what price level it will reach, which may not happen.
