

CRO @Alphractal | PhD in Physics. Ultracold atoms. Interests: condensed matter, epistemology, quantitative finance, economic cycles and crypto markets.
Joined October 2015
- Tweets577
- Following165
- Followers680
- Likes1.7K





Arch Physicist retweeted

Wild.
US and China’s combined money supply is surging almost as fast as it did during the Covid stimulus madness.
That is a 10% increase in just 12 months!
Let that sink in.
tavicosta.substack.com/p/par…

Arch Physicist retweeted

Pra quem está perdido ultimamente com tanta notícia de IA:
Eu disse isso mil vezes nos últimos 10 anos: programador bem preparado não vai ser substituido. Disse claramente "EU" nunca vou ser.
akitaonrails.com/2026/02/08/…
Quem vai? Todos que eu disse que seriam: os derivados das porcarias de bootcamps e "cursos" da última bolha. TUDO que foi "ensinado" lá é justamente TUDO que é 100% substituível por LLMs e deveriam ser mesmo. São posições que nem deveriam existir. E depois de 2022 a maioria foi cortado já.
Ao mesmo tempo, todo programador que ainda é resistente a usar LLMs precisa parar com isso e usar. Não há nenhum mérito em fazer a mesma tarefa mundana pela centésima vez. Eu realmente não vejo nenhum valor em escrever um Dockerfile na mão, ou configurar Makefile (eca). Tudo que já deveria ter sido automatizado, agora vai ser, e isso é ótimo. Fazer CRUD não tem valor. Fazer relatório não tem valor. Fazer a mesma UI que todo mundo já fez, não tem valor.
akitaonrails.com/2026/09/22/…
Ao mesmo tempo, entenda, "em breve a IA vai substituir todo programador". Não. Isso já é ficção científica. Também já disse N vezes que estamos já batendo no teto. E quem diz "ain, mas e se ..." não tem a mínima noção de custo e engenharia.
akitaonrails.com/2026/09/28/…
Estamos longe, muito longe de IA geral que substitui todas a profissões, Skynet, bla bla bla. Isso é meramente hype e psyop pra inflar valuation de IPO e conseguir influenciar governos a criar leis anticompetitivas.
akitaonrails.com/2026/09/09/…
E, em vez de "chutar" as coisas, faça como eu: adquira dados de verdade pra se basear:
akitaonrails.com/2026/09/15/…
Se entender o que eu escrevi nos artigos acima, você vai ter um entendimento muito mais amplo e matar todo seu deslumbramento excessivo.
A única coisa que importa é realidade objetiva.


Arch Physicist retweeted
This chart is a good reminder that the mining industry is generating profits on a scale no other sector in the market can even come close to matching.
tavicosta.substack.com/p/a-r…

Arch Physicist retweeted

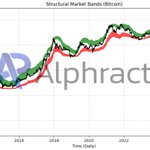
A Bitcoin structural model built by a PhD atomic physicist just put price inside its support zone.
The Structural Market Bands (SMB) — developed by @arch_physicist , Alphractal's Chief Researcher (PhD Atomic/Molecular Physics) — use coin lifespan reliability data to map the price levels where markets reach exhaustion.
Two zones: structural resistance (top) and structural support (bottom). The deeper price pushes into a zone, the stronger the counter-pressure that pulls it back.
Today's levels:
— Price: $64,526
— Structural Midline: $66,704
— Support Upper Band: $61,367
— Support Lower Band: $55,867
— Resistance Lower Band: $72,042
— Resistance Upper Band: $96,426
BTC is sitting right at the top edge of the support zone, below the midline.
The model's own rule: entering the support zone during a downtrend means the move is being driven by panic and capitulation — and the counter-pressure to correct back inside grows the deeper it goes.
One caveat the model builds in: SMB has to be read with a trend indicator. The support zone means one thing in a downtrend, another in an uptrend. The zone touch is context, not a signal on its own.
What's observable: price is in the lower structural region, resistance sits ~11% up at $72K, deep support sits ~14% down at $55.8K.
Full chart: app.alphractal.com/cryptos/c…

Arch Physicist retweeted
3/ Alphractal developed a proprietary metric that bridges both worlds: Structural Market Bands.
Inspired by the theoretical concepts of support and resistance from traditional TA but calculated entirely by absolute blockchain data.
The metric uses coin lifespan data combined rigorously with short, medium, and long-term market cap movements. Algorithmic processing estimates the price levels where the market reaches its directional exhaustion state.
Two vital trading zones emerge: structural resistance and structural support.
The key difference from classic TA: broken structural bands do NOT reinterpret levels. Support doesn't automatically become resistance. The analytical integrity stays intact through the entire cycle.
Which approach do you use for market structure, traditional support/resistance, on-chain structural, or both? Reply below.

Arch Physicist retweeted
Alphractal is the first platform in the world to ship this structural rebuild of Liquidation Levels.
These are the critical price points where leveraged positions get forcibly closed for insufficient margin. Long positions cluster zones below price. Short positions cluster zones above.
The chart maps every active cluster on BTC right now.
Here's what changed 🧵

Arch Physicist retweeted
The MVRV is widely known as a fundamental oscillator for on-chain profitability analysis.
It calculates the direct ratio between Bitcoin's market cap and realized cap the average acquisition cost of every circulating coin.
— MVRV = 1: financial neutrality.
— MVRV < 1: systemic undervaluation.
— MVRV > 1: overvaluation and latent profitability.
Below 1, the indicator marks every market bottom with precision. The red circles on the chart confirm it.
But the same simple logic fails at market tops. Here's why and the statistical fix 🧵

Arch Physicist retweeted
There is nothing more technically bullish than a 40-year resistance level turning into major support.
That is exactly where gold miners sit today.
Act accordingly.
tavicosta.substack.com/p/a-s…

Arch Physicist retweeted
Every on-chain metric you've read about Bitcoin — SOPR, MVRV, Realized Cap, Coin Days Destroyed — exists because of one architectural decision: UTXO.
Bitcoin doesn't have account balances. It has fragments. Every fragment is timestamped, valued, and traceable.
Here's the mechanics, and the metrics built on top of it 🧵
—
Bitcoin's architecture is based on an accounting model called Unspent Transaction Output — known in the market by the acronym UTXO. This concept translates as "unspent transaction outputs" and acts as the official mechanism for recording capital ownership on the network. The system manages individual fragments of coins received by users and still pending transfer.
The decentralized protocol has a structurally distinct logic from traditional banking institutions. The fiat system is based on updates to unified balances in central accounts.
The importance of this model lies in its capacity to ensure the integrity of the digital financial system. Operationally, it works through the continuous destruction and creation of these fragments. Each new transaction necessarily consumes one or more existing fragments as inputs. The process transfers financial value and generates new fragments as outputs — for the recipient and for the structural change — always after deducting network fees.
Two operational scenarios illustrate the dynamic:
— Scenario 1 (basic transaction): a wallet contains a single fragment of 5 BTC and needs to send 3.15 BTC to a recipient. The protocol consumes and destroys the original 5 BTC fragment and creates two new output fragments: 3.15 BTC effectively transferred to the recipient, and 1.85 BTC returned to the origin wallet as change.
— Scenario 2 (complex multi-input transaction): a wallet holds three distinct fragments worth 0.20 BTC, 0.15 BTC, and 0.17 BTC. The user decides to send 0.30 BTC. The system selects and destroys the 0.20 and 0.15 BTC fragments to total 0.35 BTC in inputs. The operation generates a new 0.30 BTC fragment for the recipient and a 0.05 BTC change fragment. The 0.17 BTC fragment remains unused.
This architectural mechanism enables analysts to rigorously quantify activity on the blockchain. Each fragment carries with it an exact timestamp and an immutable financial value. Observing this data enables tracking the age of capital, identifying structural accumulation levels, and measuring the temporal behavior of investors.

Arch Physicist retweeted

On-chain levels map Bitcoin’s price history like no other metric does.
And for Bitcoin, price has just reached a key resistance level. Tomorrow we will see whether it has enough strength to break through it.
This metric is based on CVDD, but unlike the CVDD used by other platforms, Alphractal’s CVDD was adjusted based on Bitcoin’s issuance eras rather than a fixed value. Full credit for this improvement goes to @arch_physicist!

Arch Physicist retweeted
One of the most useful ways to think about long-term investment theses is through 10-year rolling performance windows across asset classes.
Monetary assets like gold historically go through very long periods of both outperformance and underperformance.
We are still in the early innings of this cycle.
open.substack.com/pub/tavico…

Arch Physicist retweeted

"Compra S&P500. Bolsa sempre sobe."
Buffett (e Munger) está com a maior posição de caixa da história da Berkshire.
Benjamin Graham, o pai do value investing, estaria fora do mercado. Falta margem de segurança.
John Templeton estaria migrando capital para fora dos EUA.
Peter Lynch estaria comprando, mas ações específicas — nunca o índice cegamente.
Joel Greenblatt estaria ignorando o índice e garimpando small caps esquecidas.
Stanley Druckenmiller declarou publicamente em fevereiro: está comprado em cobre, ouro e vendido em dólar e Treasuries. IA não é mais o tema central.
Ray Dalio projeta retorno de longo prazo do S&P500 em 4,7% ao ano — abaixo dos próprios títulos do Tesouro americano.
Howard Marks, um dos maiores estudiosos de ciclos de mercado da história, está operando com cautela máxima.
Os maiores investidores de todos os tempos estão, cada um da sua maneira, evitando o índice.
Mas compra S&P. Bolsa sempre sobe. Confia.

ALT SPX deflacionado pela oferta monetária dos EUA. Estamos nos níveis de 2000.
Arch Physicist retweeted
It’s wild to see copper hitting record highs while still trading near historical lows when priced in gold terms.
The copper-to-gold ratio remains nearly 80% below its 2006 peak.
More importantly:
Periods where copper became this cheap relative to gold have historically not lasted very long.
tavicosta.substack.com/p/cop…


Arch Physicist retweeted

Holy shit. The biggest unsolved problem in AI agents isn't reasoning it's memory. Your agent forgets everything between sessions.
MemFactory just open-sourced the first unified framework for training agents to manage their own memory via reinforcement learning. Extract.
Update. Retrieve. All trainable. All modular. Runs on one GPU.
Every AI agent built today is amnesiac by design. It can reason. It can plan.
It can use tools. But the moment a session ends, everything it learned about you, your preferences, your context, and your history disappears.
The next conversation starts from zero.
This is not a minor inconvenience it is the fundamental barrier between AI assistants and AI agents that actually work over days, weeks, and months. The field has known this for years.
The solutions have been fragmented, task-specific, and impossible to combine. Memory-R1 handles structured CRUD operations on a memory bank. MemAgent compresses history into a fixed-length recurrent state.
RMM optimizes retrieval through retrospective reflection. Each works.
None can be combined. Each lives in its own repository with its own data format, its own training pipeline, and its own set of assumptions. MemFactory ends that fragmentation.
The core insight is that memory management is a decision problem, not a retrieval problem. Current systems treat memory as a database store things, look things up.
MemFactory treats memory as a policy an agent that learns when to extract new information, when to update existing memories, when to delete contradicted facts, and what to retrieve for any given query.
That policy is trained via reinforcement learning, specifically Group Relative Policy Optimization, which eliminates the need for a separate critic model and cuts training memory requirements in half.
This matters because memory-augmented agents already have saturated context windows from dialogue history and retrieved content.
The last thing they need is a training algorithm that doubles the memory footprint.
The architecture is four layers that compose like Lego blocks.
The Module Layer decomposes memory into atomic operations:
> Extractor parses raw conversations into structured memory entries,
> Updater decides whether each new piece of information should be added, modify an existing entry, delete a contradiction, or left alone,
> Retriever fetches relevant memories using semantic search or LLM-based reranking.
The Agent Layer assembles these modules into a complete memory policy and executes rollout trajectories during training.
The Environment Layer standardizes any dataset into the format the agent needs and computes reward signals format rewards for structural compliance, LLM-as-a-judge scores for quality.
The Trainer Layer runs GRPO to update the memory policy based on those rewards. Every module plugs into every other module through standardized interfaces.
You can swap the retriever in Memory-R1 for an LLM-based reranker without touching anything else.
The results from training a MemAgent-style architecture through MemFactory on two base models:
→ Qwen3-1.7B base: average score 0.3118 across three evaluation sets
→ Qwen3-1.7B after MemFactory RL: 0.3581 14.8% relative improvement
→ Qwen3-4B-Instruct base: average score 0.6146
→ Qwen3-4B-Instruct after MemFactory RL: 0.6595 7.3% relative
improvement
→ 4B model gains hold on out-of-distribution benchmarks the memory policy transfers to unseen tasks
→ Entire training and evaluation pipeline runs on a single NVIDIA A800 80GB GPU
→ 250 training steps on simplified long-context data no massive compute cluster required
→ Three ready-to-use agent architectures out of the box: MemoryR1Agent, MemoryAgent, MemoryRMMAgent
> The out-of-distribution result is the one that matters most. The 1.7B model improved on in-domain tasks but slightly degraded on the OOD benchmark the learned policy was too specific to the training distribution.
The 4B model improved on both.
This is the capability threshold at which a memory policy becomes genuinely general: large enough to abstract principles about what information is worth keeping, not just pattern-match on training examples.
A memory agent that only remembers the right things in familiar situations is not much better than no memory at all.
The 4B result suggests that threshold is reachable with models that fit on a single consumer GPU.
> The fragmentation problem MemFactory solves is deeper than it looks. When every memory implementation has its own pipeline, researchers cannot compare approaches fairly.
Two systems that nominally differ by one design choice say, CRUD operations versus recurrent state compression actually differ simultaneously in data format, reward structure, training algorithm, and evaluation protocol.
Nobody knows which choice caused which outcome.
MemFactory puts all three major paradigms under the same training loop, the same reward computation, and the same evaluation framework.
Now you can actually isolate what matters.
Your agent forgets everything. This is the infrastructure to fix that.

Arch Physicist retweeted
How to build a Custom Dashboard that works as a decision system.
5 steps.
Step 1: Click "+ New Dashboard"
A blank panel opens.
Name it after its objective.
Good examples:
→ "Market Overview"
→ "Top & Bottom Timing"
→ "Short-Term Setup"
The name sets the intention. If the name is vague, the dashboard will be too.
Step 2: Define the objective before adding anything
One question before you touch a single chart:
"What decisions is this dashboard going to help me make?"
→ Is the market overpriced or underpriced?
→ Is a trend starting or ending?
→ Should I increase or reduce exposure?
If you can't answer that clearly — you're building a collection, not a system.
Step 3: Add charts that complement, not duplicate
Less is more.
A solid starting structure:
→ Risk / cycle metric
ex: Market Temperature
identifies excess optimism or pessimism
→ On-chain behavior
accumulation or distribution signals
→ Price + context
aligns on-chain data with price action
If two metrics tell you the same thing
with different names, remove one.
Step 4: Organize the visual flow
Drag charts into a logical reading order:
→ Top: market regime metrics (macro / cycle)
→ Middle: confirmation metrics (on-chain, sentiment)
→ Bottom: execution metrics (price, momentum)
Top to bottom = context to decision.
You don't look at timing until cycle and on-chain confirm.
Step 5: Use it as a daily checklist
Open the same dashboard every day. Read it in the same sequence.
Over time, patterns become visible.
When Market Temperature enters an elevated zone
while other metrics decelerate — asymmetric risk becomes clear before
price confirms it.
That's the edge a structured dashboard builds.
Arch Physicist retweeted
Which past year does Bitcoin’s 2026 resemble?
Starting with bear market years like 2014, 2018, and 2022.
See more in the thread:


Arch Physicist retweeted
The biggest launch in Alphractal’s history is now officially live! 🎉
After months of rebuilding the platform from the ground up, the new Alphractal experience is officially here.
This release goes far beyond interface changes.
It restructures how data is organized, consumed, and acted upon.
What’s included in the update:
• New UX Architecture — redesigned navigation logic, reduced cognitive load, optimized information hierarchy
• Fully Customizable Dashboard — modular widgets, metric pinning, layout control, multi-chart structuring
• Smart Alert System — condition-based triggers across on-chain, derivatives, and macro metrics
• Alpha AI — contextual interpretation of charts, liquidity conditions, positioning data, and cycle structure
• Performance Optimization — faster data rendering, improved chart responsiveness, streamlined workflow
• High-Performance Data Engine — faster database architecture, lower latency queries, improved real-time processing
• Advanced Variation Selectors — dynamic statistical filters, multi-timeframe deviation analysis, volatility-adjusted views
• TradingView Beta Integration — professional-grade charting embedded directly into the Alphractal workflow
• New Alpha Metrics — proprietary cycle, liquidity and positioning indicators built for macro-aware accumulation
The objective remains simple:
More signal density.
Less operational friction.
Higher decision efficiency.
The next evolution of Alphractal starts now.
Explore the update 👇