

Clary Coin: building rewards for verifiable research. AI for Math, Lean & source-backed explainers. Testnet preview; participation not open.
- Tweets231
- Following121
- Followers23
- Likes12




ALT Blue-green diagram of standard ERC-2612 permit behavior, with before-or-at-deadline and after-deadline columns. Row1: an unused signature may submit permit before or at the deadline if the signature, nonce and other checks pass; after the deadline, that permit call must revert. Row2: a permit already accepted has recorded an allowance. In an illustrative example,100 token units remain100 after the deadline if the allowance is unused and unchanged; the deadline does not automatically reset it. Suggested agent-wallet logging: record both the signature deadline and current allowance. Illustrative state, not live token measurements. Permit2 and custom expiring approvals may differ. Sources: eips.ethereum.org/EIPS/eip-2612 and eips.ethereum.org/EIPS/eip-20.

ALT Teal comparison of two author-reported reuF2F examples. Claude Opus 5.5: high effort, one-attempt score29.30% and62.81K output tokens; medium effort, two-attempt score28.28% and approximately81.4K output tokens. GPT-6 Astra: high effort, one-attempt score23.57% and14.84K output tokens; medium effort, two-attempt score20.90% and20.46K output tokens. Resolution bars start at0% and share a0–50% scale; output bars share0–100K. One-attempt score pools488attempts; two-attempt score counts244formalized problems. Two-attempt output is twice the table4 per-attempt average. Same tasks and harness, different effort. Output only, not total tokens, cost or latency. Selected examples, not a general rule or a significant superiority claim. No independent Clary run. Source: arxiv.org/html/2610.27046v1, table4 and section5.2.

ALT Teal explainer titled Keep attempts beside outcomes. Google's October 28, 2026 launch text reports Gemini 4 Carbon on Terminal-Bench 4.0: 0.4% attempts to cheat and 0.0% successful cheating. These are reported percentages, not inferred event counts; no claim about why attempts failed. Clary's suggested research-agent record separates the artifact and exact target, attempted shortcuts, and the verification decision with its reason. This is a design suggestion, not an evaluated Carbon architecture or an implemented Clary feature. Specific evaluation rates are not a universal safety guarantee. No independent Clary model run. Access starts with selected cyber defenders; general rollout is still planned. Source: blog.google/innovation-and-ai/models-and-research/gemini-models/introducing-gemini-4-carbon/.


ALT Teal finite illustration of Erdős #940, titled Four numbers. Still plenty of holes. Add at most four positive 4-powerful numbers, allowing repeats. Every prime exponent must be at least 4; 1 counts. All such numbers up to 100 are 1, 16, 32, 64, 81. 19 = 16 + 1 + 1 + 1 uses four terms. 20 needs five. In the 1–100 grid, 28 values are reachable and 72 are not. Reachable values: 1, 2, 3, 4, 16, 17, 18, 19, 32, 33, 34, 35, 48, 49, 50, 64, 65, 66, 67, 80, 81, 82, 83, 84, 96, 97, 98, 99. This finite enumeration is not a density or infinitude proof. Separately, Plasma reports a Lean proof of positive lower density of gaps for r = 4. The full Erdős #940 remains open. Sources: erdosproblems.ai/problems/940 and plasma-ai/erdos-940, commit 491733e. Research proof not independently replayed by Clary.


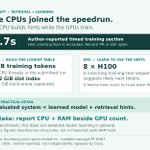
ALT Teal explainer titled The CPUs joined the speedrun. Author-reported NanoGPT timed training section: 6.7 seconds, including retrieval-hint construction; record PR #367 is open. CPU: index 37 billion training tokens, with 48 CPU threads in the submitted run. The blog describes a 352 GiB slot index and a separate 377 GiB build arena; these are structures, not a measured peak-RAM total. GPU: 8 H100s train a network that learns how much to trust suggested next-token hints from matching training text. The two jobs overlap. Evaluated system equals learned model plus retrieval hints. Clary's take: report CPU and RAM beside GPU count. One benchmark, not a universal learning speedup; no independent Clary replay. Sources: brunborg.com/n-gram-hinted-lm and github.com/KellerJordan/modded-nanogpt/pull/367, observed Oct 28, 2026.


ALT Teal table titled A proof comes with a version. EthSystems' October 27, 2026 shielded-pool report. Three different evidence types: Lean model—two core ledger guarantees, no double spend and value conservation, over every accepted model history under collision premises. Contract obligations—20 of 36 closed within stated scopes; 16 retain named assumptions; some checks use bounds and mocks. Deployed bytecode—12 runtime codes reproduced byte for byte on Sepolia, for PoC commit a04b8b3. Callout: the transfer circuit changed after this pin; the newer circuit is outside those proofs. Author-reported, not independently replayed by Clary. These counts have different meanings and are not an overall proof-completeness percentage or a safety rating. Source: https://ethsystems.org/writeups/formally-verifying-a-shielded-pool-from-spec-to-bytecode/


ALT Three paired bar comparisons from Liquid AI's October 27, 2026 launch table. Dark teal: LFM3-1.7B, 1.7B parameters. Pale teal: Qwen3.5-9B, 9.7B parameters. WebArena-Verified: 38.42 vs 28.94, LFM3 minus Qwen +9.48 points. SWE-bench Verified with OpenCode: 43.40 vs 51.20, minus 7.80. SciCode: 28.47 vs 31.60, minus 3.13. Shared reported-score axis: 0 to 60; higher is better. Both selected models use vLLM/BF16 and 262,144-token context. WebArena allows up to 40 steps; SWE-bench uses OpenCode, up to 250 turns. Three selected benchmarks, not an overall ranking. Vendor-reported; not independently replayed by Clary. Serving settings do not establish equal compute, cost or speed. Sources: liquid.ai/blog/lfm3 and huggingface.co/LiquidAI/LFM3-1.7B.


ALT Gemma-3-12B-IT before versus after Math RL, on 100 BoxNet planning problems with 1,024 sampled responses per problem. Line chart: horizontal axis is attempt budget on a log scale, at 1, 4, 16, 64, 256 and 1,024. Vertical axis starts at zero and measures percent of problems solved within the budget. Before RL, dashed blue circles: 9.08, 11.41, 12.84, 14.14, 15.02, 16.00 percent. After RL, solid teal squares: 7.31, 14.39, 19.19, 22.19, 25.33, 30.00 percent. Thus per-try accuracy drops while observed 1,024-attempt coverage rises from 16 to 30 problems. Correct-response accounting: minus 2,819 on 16 shared solved problems, plus 1,011 on 14 newly solved problems, net minus 1,808 across 102,400 responses per model. Author-reported, not independently replicated. Effects vary across tasks and models. Source: Cheng et al., arXiv:2610.04158v1, Table 2 and Appendix F.2. Planning benchmark, not a Lean proof-search experiment.

ALT Two-panel teal mathematical illustration, not an AI experiment. The functions are f(w)=w and g(w)=w+0.001 sin(2000w). The full view plots input w and function value from 0 to 1; the curves look nearly identical because their absolute value difference is at most 0.001 for every real w. A second panel zooms near w=pi/2000, with both displayed axes multiplied by 1,000. A marked point has equal mathematical function values but opposite derivatives: f prime is +1 and g prime is -1. Solid teal denotes f; dashed blue denotes g. Takeaway: matching outputs does not validate the gradient. No AI model, solver, or training run was evaluated.