

I’m a winter weather nut living in a warm climate in North Carolina, and neither of those is going to change
Charlotte, NC, USA
Joined July 2015
- Tweets5.5K
- Following490
- Followers2.1K
- Likes10.7K





griteater retweeted

Thanks! The latest SAI is in, and it proves the constant positive bias from ECM. Still ended up above average tho.

griteater retweeted

More astounding westerly wind anomaly events in the AIFS forecast for the equatorial Pacific. Historically in major El Niño events, these typically shut down sometime between December and January.

David! Clearly you've been busy!
If you are looking for advanced meteorological discussion and information, I'd highly suggest you follow this guy, and his website gsdmsolutions.com. His follower numbers are grossly undervalued.
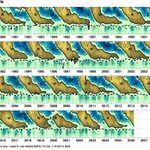
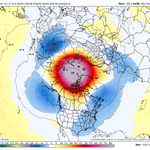
Great info in your SSW blog post here. The one piece I thought was especially interesting was your info on how new blocking over Greenland follows weak-vortex events that don't qualify as SSWs about as often as with SSWs that descend into the lower strat. I tried to make that point in a post last Nov. Example I used was from Nov-Dec 2000 (images below).
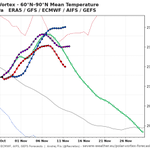
Last point: I've enjoyed following the trends on the Euro Op (IFS) with this event as I feel like it has performed the best (GFS has been solid too), with the Euro AI really lagging and playing catchup with its output. I like the idea of the Op being at the highest possible resolution through the trop and strat (I think anyway) and it using that to its advantage with its output. Of course, I understand the use of ensembles in tracking this too, and you are using some advanced tools with those it looks like
Glad to see you throw the winter weather nuts a bone with your new strat pages here!! Take care!


Following up on my previous announcement that gsdmsolutions.com will soon feature a page devoted to SSW events and the causal chain in which they’re embedded, I have created a new free post: understanding the predicted SSW, from cause to consequence.
El Nino’s eastern Pacific forcing —> wave train —> Russian ridge —> SSW event. Yet the subseasonal forecast is “El Nino-fueled” mild weather, nearly the mirror image of what often follows SSW events that impact tropospheric winter weather.
gsdmsolutions.com/blog/ssw-n…


This is basically what I’ve done all year to see what the weather is going to be like for weekend golf - just look at the Euro AI and WeatherNext (Google DM). Don’t bother much with the others

🌀AI Models Dominate Isaias Forecast
By now you’ve heard that Google Deep Mind nailed the #Hurricane #Isaias track forecast, but this shows just how dominant it was. The graph shows the forecast error… less error = more accurate.
~72 hours before landfall out the Google Deep Mind AI ensemble was only off by 19 miles, Euro AI by only 36 miles! There are lots of negative uses of AI, but weather forecasting is one example in which AI can be beneficial.

griteater retweeted

🌀AI Models Dominate Isaias Forecast
By now you’ve heard that Google Deep Mind nailed the #Hurricane #Isaias track forecast, but this shows just how dominant it was. The graph shows the forecast error… less error = more accurate.
~72 hours before landfall out the Google Deep Mind AI ensemble was only off by 19 miles, Euro AI by only 36 miles! There are lots of negative uses of AI, but weather forecasting is one example in which AI can be beneficial.


griteater retweeted

The September global atmospheric angular momentum (GLAAM) index was the highest monthly value since at least 1950 (ERA5 data).
This illustrates the atmospheric component of the extreme El Niño: Pacific convection is transferring huge westerly momentum away from the equator


The chart is based on data related to this paper from Takahashi et. al - ENSO regimes: Reinterpreting the canonical and Modoki El Nino - agupubs.onlinelibrary.wiley.…
Data: met.igp.gob.pe/datos/ecindex…
ENSO Data from Eric Webb: webberweather.com/ensemble-o…


griteater retweeted

An amazing video of Dolly Parton singing one of her most famous songs in Páidí Ó Sé’s pub in Ventry Co. Kerry 🇮🇪 in 1990
How did Páidí pull that coup off
#RIPDolly
Aug 19 release of the IRI dynamical multi-model ENSO average shows an El Nino tri-monthly peak of +3.4 occurring in OND & NDJ.
Here is how much the dynamical multi-model peak has risen since the March model release:
March: +1.5 (NDJ)
April: +1.8 (OND & NDJ)
May: +2.2 (OND & NDJ)
June: +2.6 (SON)
July: +3.2 (OND)
August: +3.4 (OND & NDJ)
Here are the all-time highest ENSO tri-monthly values from Eric Webb's ENSO Ensemble ONI Index research back to 1850 (+2.4 or greater shown):
1877-1878: +2.6 (OND), +2.7 (NDJ), +2.7 (DJF)
1982-1983: +2.4 (NDJ), +2.4 (DJF)
1997-1998: +2.4 (SON), +2.5 (OND), +2.6 (NDJ), +2.5 (DJF)
2015-2016: +2.6 (OND), +2.7 (NDJ), +2.5 (DJF)
Reference: webberweather.com/ensemble-o…
#ElNino
